Namibia | Glider Pilots Fly One Million Kilometres


From a glider pilot's point of view, Namibia indeed seems to be the land of extremes. Last season, 1.2 million points were added to the WeGlide in the free distance scoring, in just under three months. This was accomplished by 189 gliding enthusiasts in 10,375 hours, and only 63 gliders. No less than 1.2 million kilometers were covered. I could start to compare with distances to the moon or circumferences of the earth, much rather I look back on the past season in Germany.
Between April and the end of August, around 44,000 flights were uploaded in the DMSt, covering an average of 258 km. In Namibia, there were 1506 flights in just under 3 months, each with an average of 806 km and 809 points. If you filter out the "afternoon flights" with < 750 km, it is 995 points - awesome!
Even the point average of flights > 750 km on July 06, the best day of the year in Germany (955 points) is below the point average over the entire Namibian season (995 points). In short, in Namibia, it goes neatly to the point.
1100 Are the New 1000
Gliding in Namibia - quite a few will immediately think of 1000 km here. How many flights have cracked the magic mark in free-scoring during the 22/23 season?
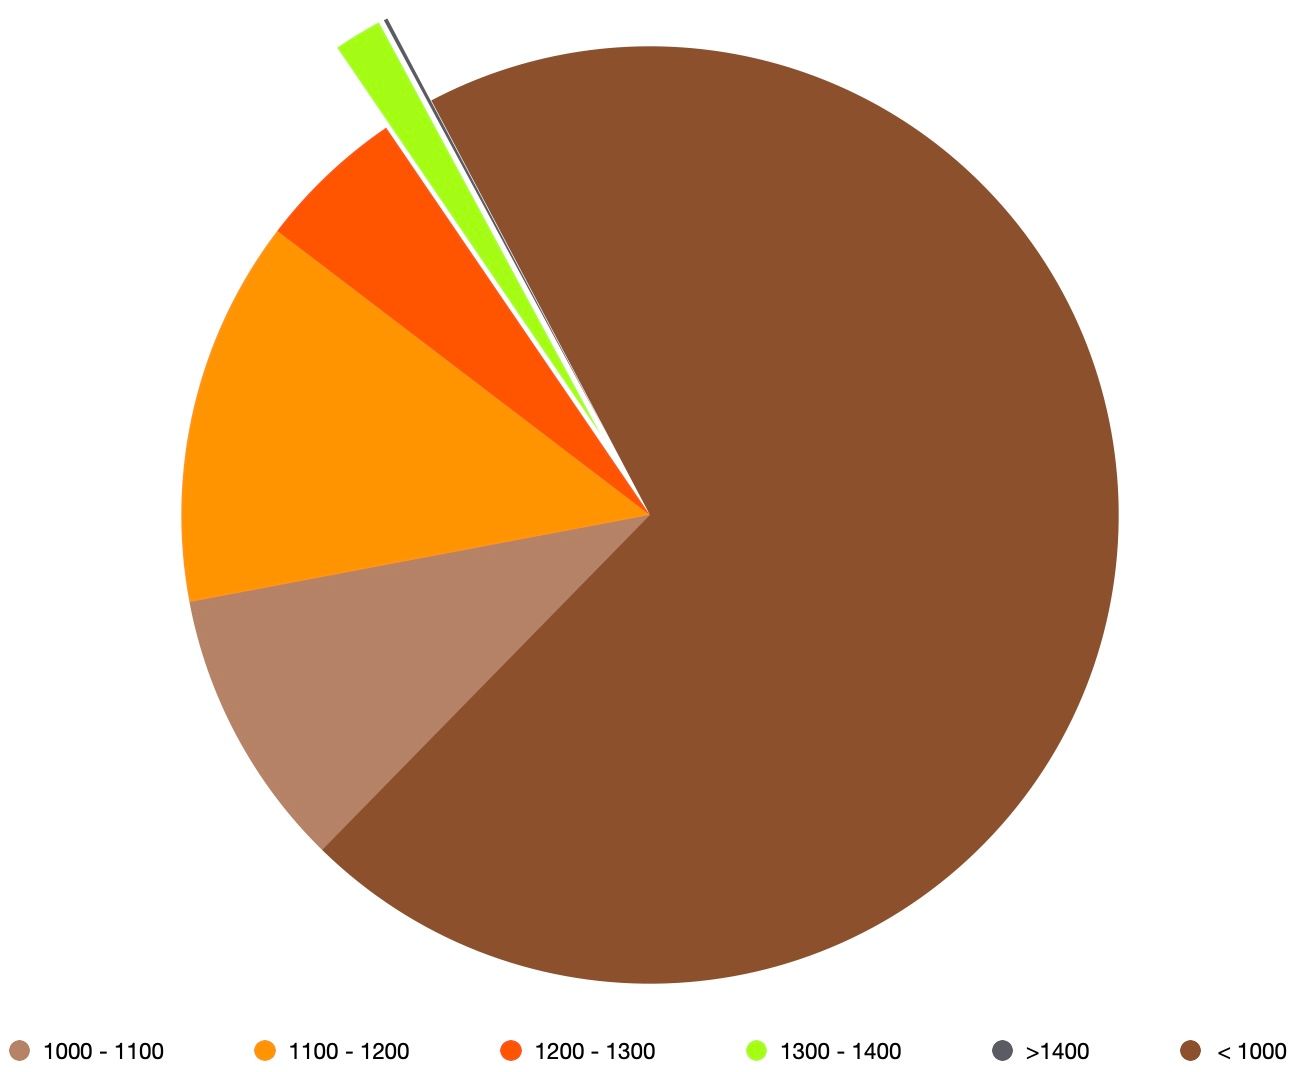
From the total of 1506 flights, 451 were over 1000 km. However, it is no news that 1000 km is no longer the tip of the iceberg. Most striking: with 201 scores between 1100 km and 1200 km more flights were made than between 1000 km and 1100 km (146). Also, achievements over 1200 km are with 77 flights not a rarity anymore. Really rare are the performances over 1300 km (25) and especially over 1400 km. The last one occurred only twice.
By the way, last season 7 juniors (5% of the pilots) were involved in these achievements. A big thank you goes to Wilfried Grosskinsky and the Bitterwasser Flying Lodge for the annual award of the Bitterwasser Cup.
Bitterwasser, Veronica, Pokweni or Kiripotib?
Where was most of the flying done? Bitterwasser clearly emerges as the most active airfield. With 731 flights, the gliding center submitted nearly as many flights as Veronica (357 flights), Kiripotib (211 flights) and Pokweni (205 flights) combined. In addition, with 89 pilots, about 50% of Namibia's flights departed from Bitterwasser. For example, Pokweni, with 20 pilots, seems to have a much more familiar atmosphere - so you can choose the starting point according to your preferences.
The number of flights and pilots is one thing, but how many points did the airfields submit? Although Bitterwasser is clearly in the lead in terms of total points, the other ones flew at a similarly high level. This becomes clear when looking at the average scores per flight:
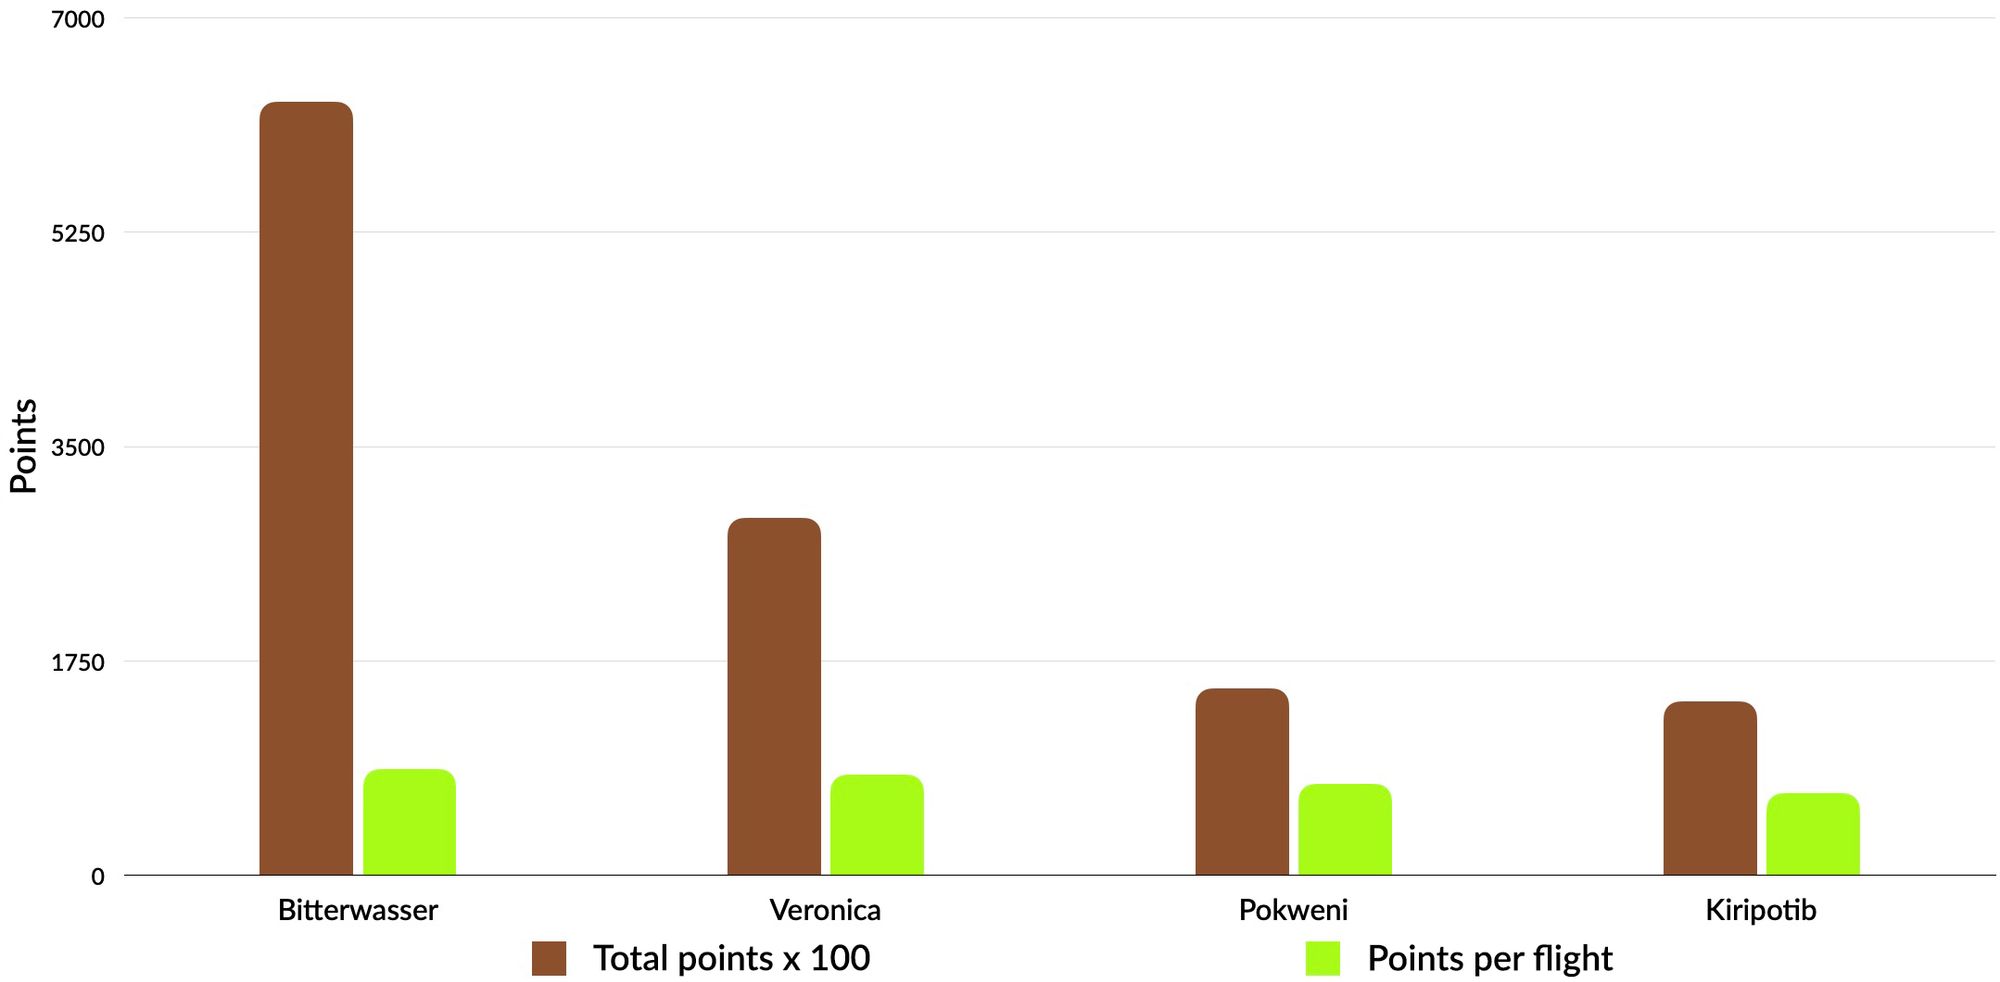
The total score achieved by Bitterwasser is indeed remarkable (631,910 points). With an average of 864 points, the best flights were also done here. However, the points per flight of the airfields do not differ as significantly as the total scores. Thus also in Kiripotib an average of 700 points were flown.
Again, Winch Launches in Namibia?
Are there only take-offs by self-launchers at the moment? Not quite, after trying our winch filter, we became aware of three interesting launches in Veronica:
To be more precise, they were car tows with a pulley. Jörg Mathes has written an exciting comment under his 1000km flight:
This was the first test tow with the pulley in Veronica. The winch cable is guided to the towing vehicle via a pulley. Thus the complete airfield extension is available as rope length. From the technical point of view, it is a winch launch where the rope is not spooled but pulled through the pulley. Despite some technical problems (traction, crack of the predetermined breaking point) we directly reached 580 m above ground level with one minute towing time at a maximum climb of 15.5 m/sec. With the help of this technology, low-powered self-starters, electrified self-starters (to save energy), temperature-sensitive self-starters (all AS models with Wankel drive), turbo's (JS3T, AS33 ES, Ventus 3T,...) but also pure gliders could be brought into the Namibian gliding skies. Surprisingly, the thermals had already started, so I was then allowed to fly the first 1000 out of the winch in Namibia after many decades without water ballast and co-pilot.
It remains to be seen if we see more glider types over Namibia.
63 Gliders
The Arcus gliders alone spent over half a year in the air!
Let's talk more about the material and have a closer look at the aircraft types of the last season. Flights were uploaded to WeGlide with 63 different aircraft, most of them two-seaters. Of the 10,375 hours, 73% were flown in this type of glider, and three-quarters of the two-seater flights were flown in the Arcus. So from an hourly perspective, the Arcus gliders alone spent over half a year (5601 hours) in the air!

After that, nothing follows for a long time, until the Ventus 3M takes second place with 950 hours, followed by the HpH 304 Twin Shark (948 hours).
Which aircraft was flown the most? An Arcus M? Rather the opposite - with the Eta this race was made by a real exotic. The glider of the Deutsche Segelflugverband e.V. flew 355 hours from Veronica last season, which neatly exceeds the average of 165 hours per glider in Namibia.
When Will the 1500 KM Be Cracked?
We have a look at the flight tracks that were created last season. It is amazing how the numerous flights managed to draw a nearly perfect circle around the restricted airspace of Windhoek.
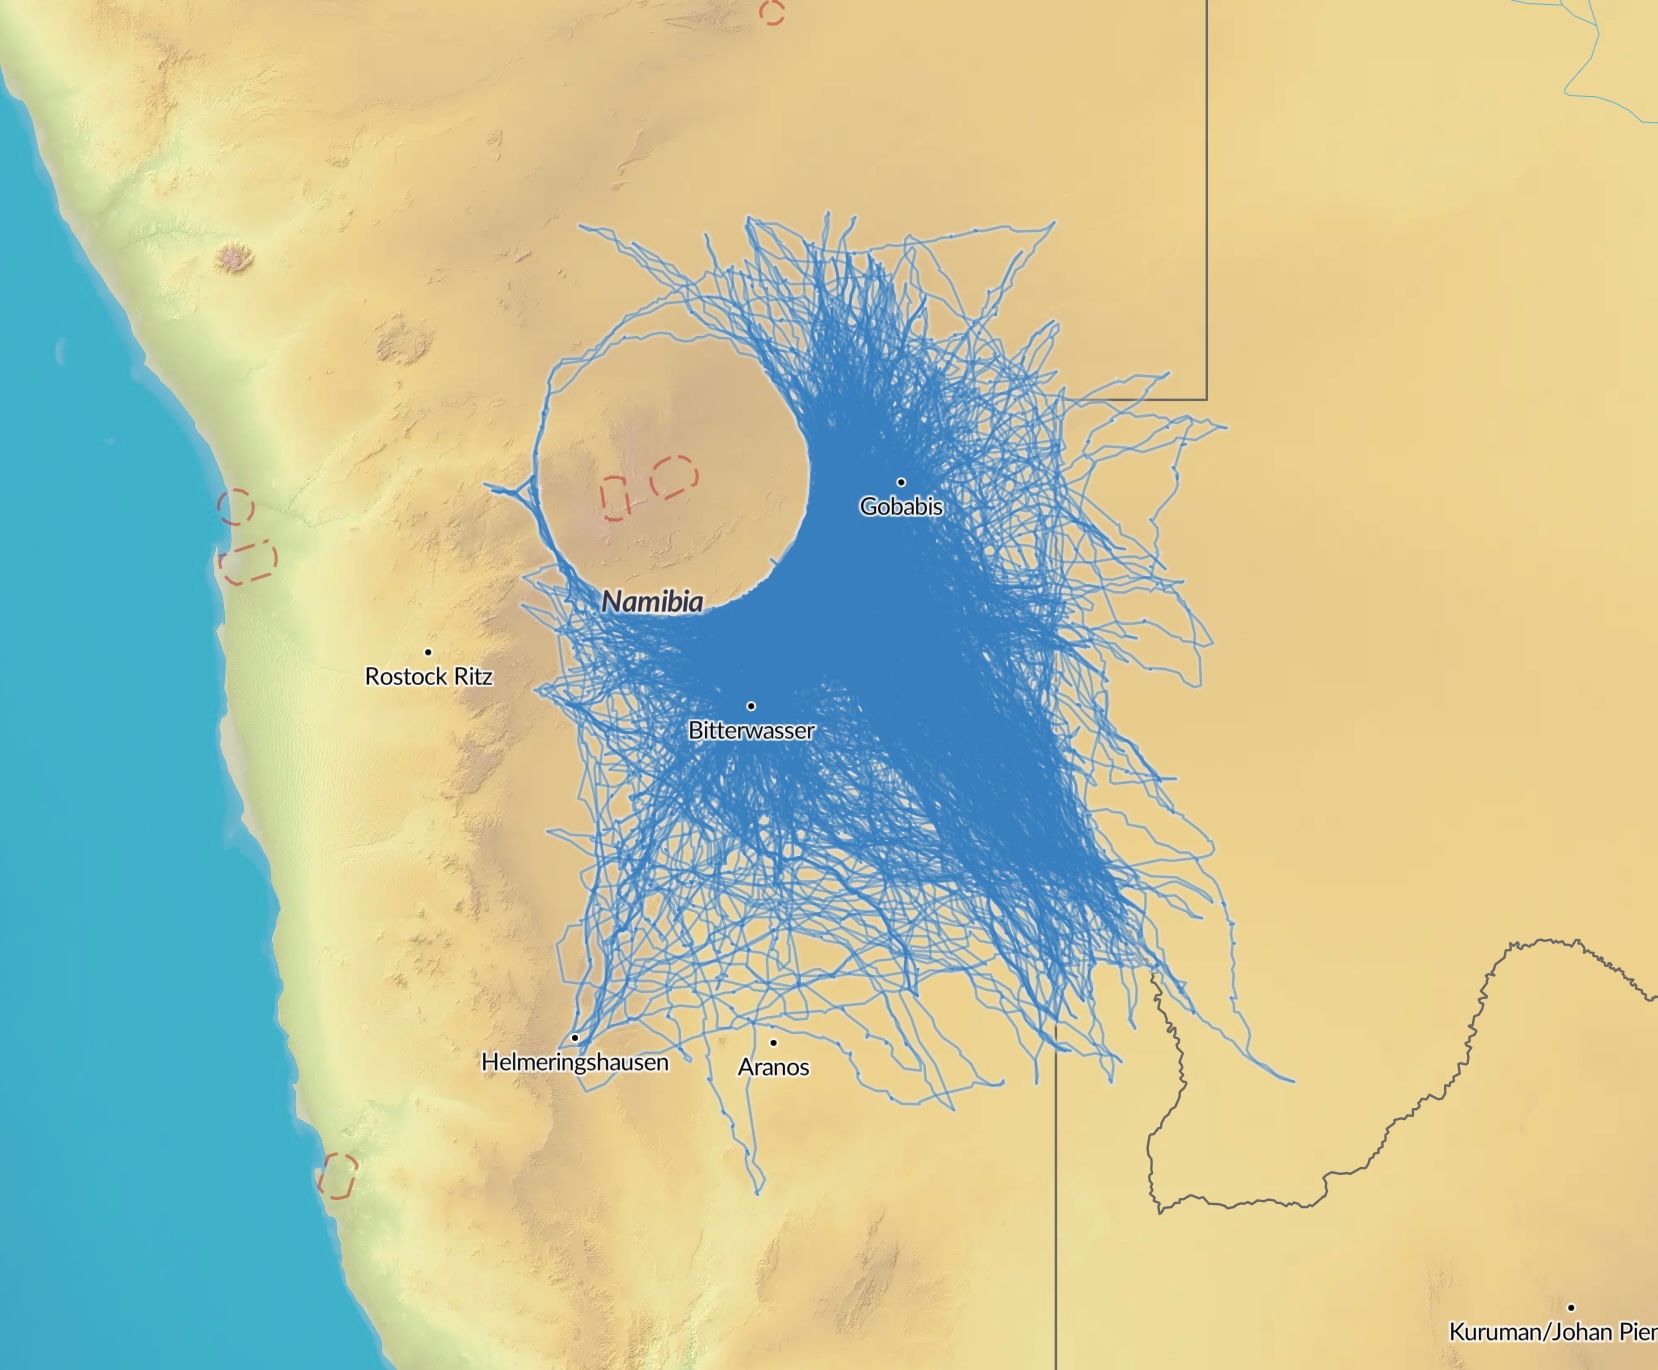


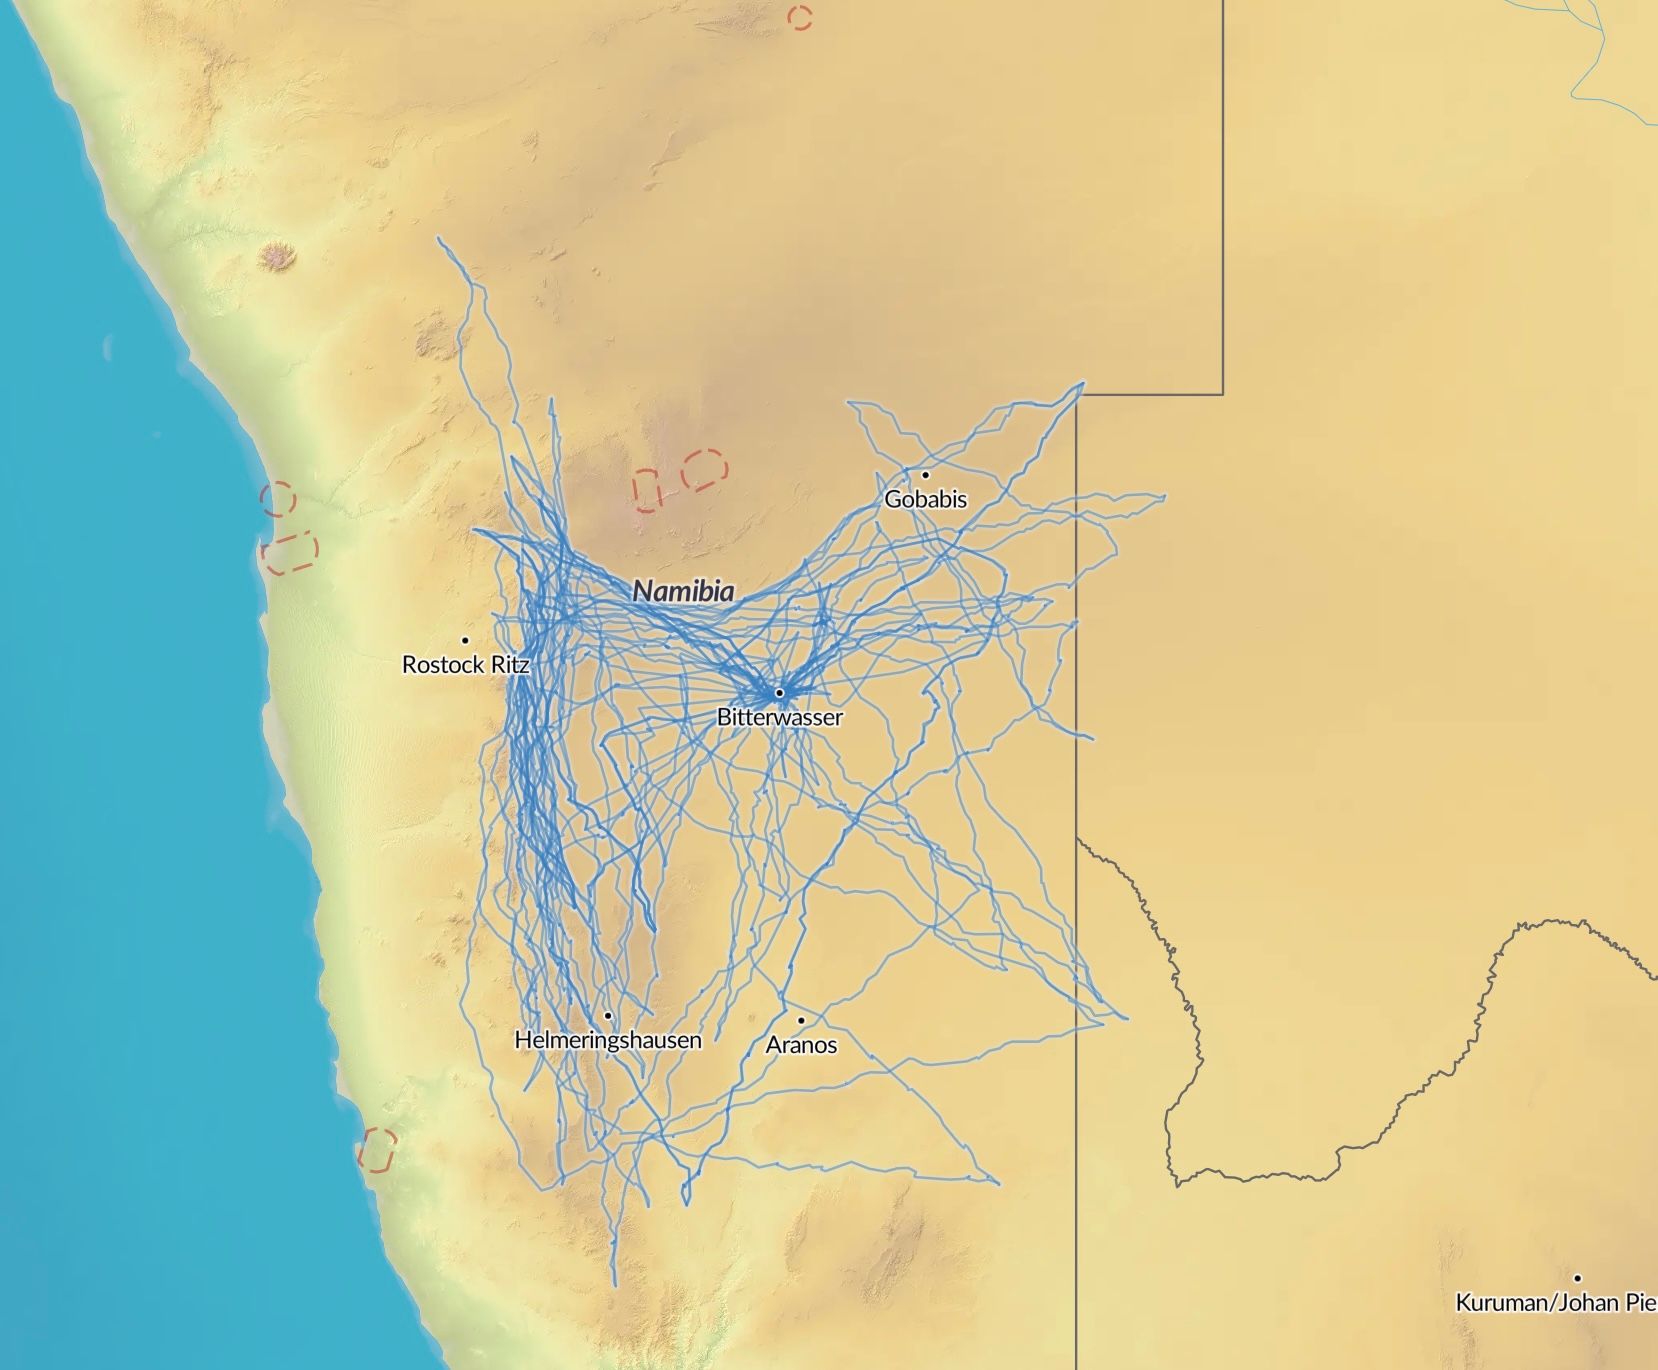
In all directions, some runaways are clearly visible. Especially the north-west is flown more and more. However, in November the east was flown the most. In December the flight paths lead also at the infamous "edge" to the Namib in the west, very often. In January there were some interesting flights to the northwest, which was not so highly frequented in the past years. We are curious about what is still to come here.
Also interesting is the map of the very large flights (>1300 km). Here it becomes clear that the northern part of the "edge" has often been included in the route planning of the pilots.
We have highlighted the longest flight of the free ranking in the map. By doing 1455 km Simon Schröder completed a historic flight in the Quintus M on January 8 and replaced the long-standing kilometer record of Matthias Arnold from 2016 (1433 km) - Congratulations Simon! Not even 50 km separates us now from the 1500 km in Namibia - it seems only a matter of time.
Pointwise, however, Simon has to subordinate himself to a flight. Here, Maximilian Schäfer and Simon's sister Eva Schröder held their own in the Arcus M. With 1460 points, the two were able to take first place for the season. However, the all-time record still holds Matthias Arnold with the aforementioned flight and 1533 points. Matthias flew a Ventus 2cxM at that time and was a winner of the Bitterwasser Cup as well.
433 KM in Two Hours
That was the best performance of the sprint ranking last season. It was flown by 🥇 Bernd Dolba on the 25th of November. An amazing average speed of 216 km/h did his JS 3 RES.
It is noteworthy that only one of the top ten sprints was flown in December. The remaining nine scores took place in November. The 25th of November, along with the 10th of November, were the best days for fast sprints. Four scores each appear in the top ten.
Bernd Dolba surpassed the second-fastest Eric Schneider with a whopping 14 km/h on the 25th of November. A look at the statistics list gives some insights here:
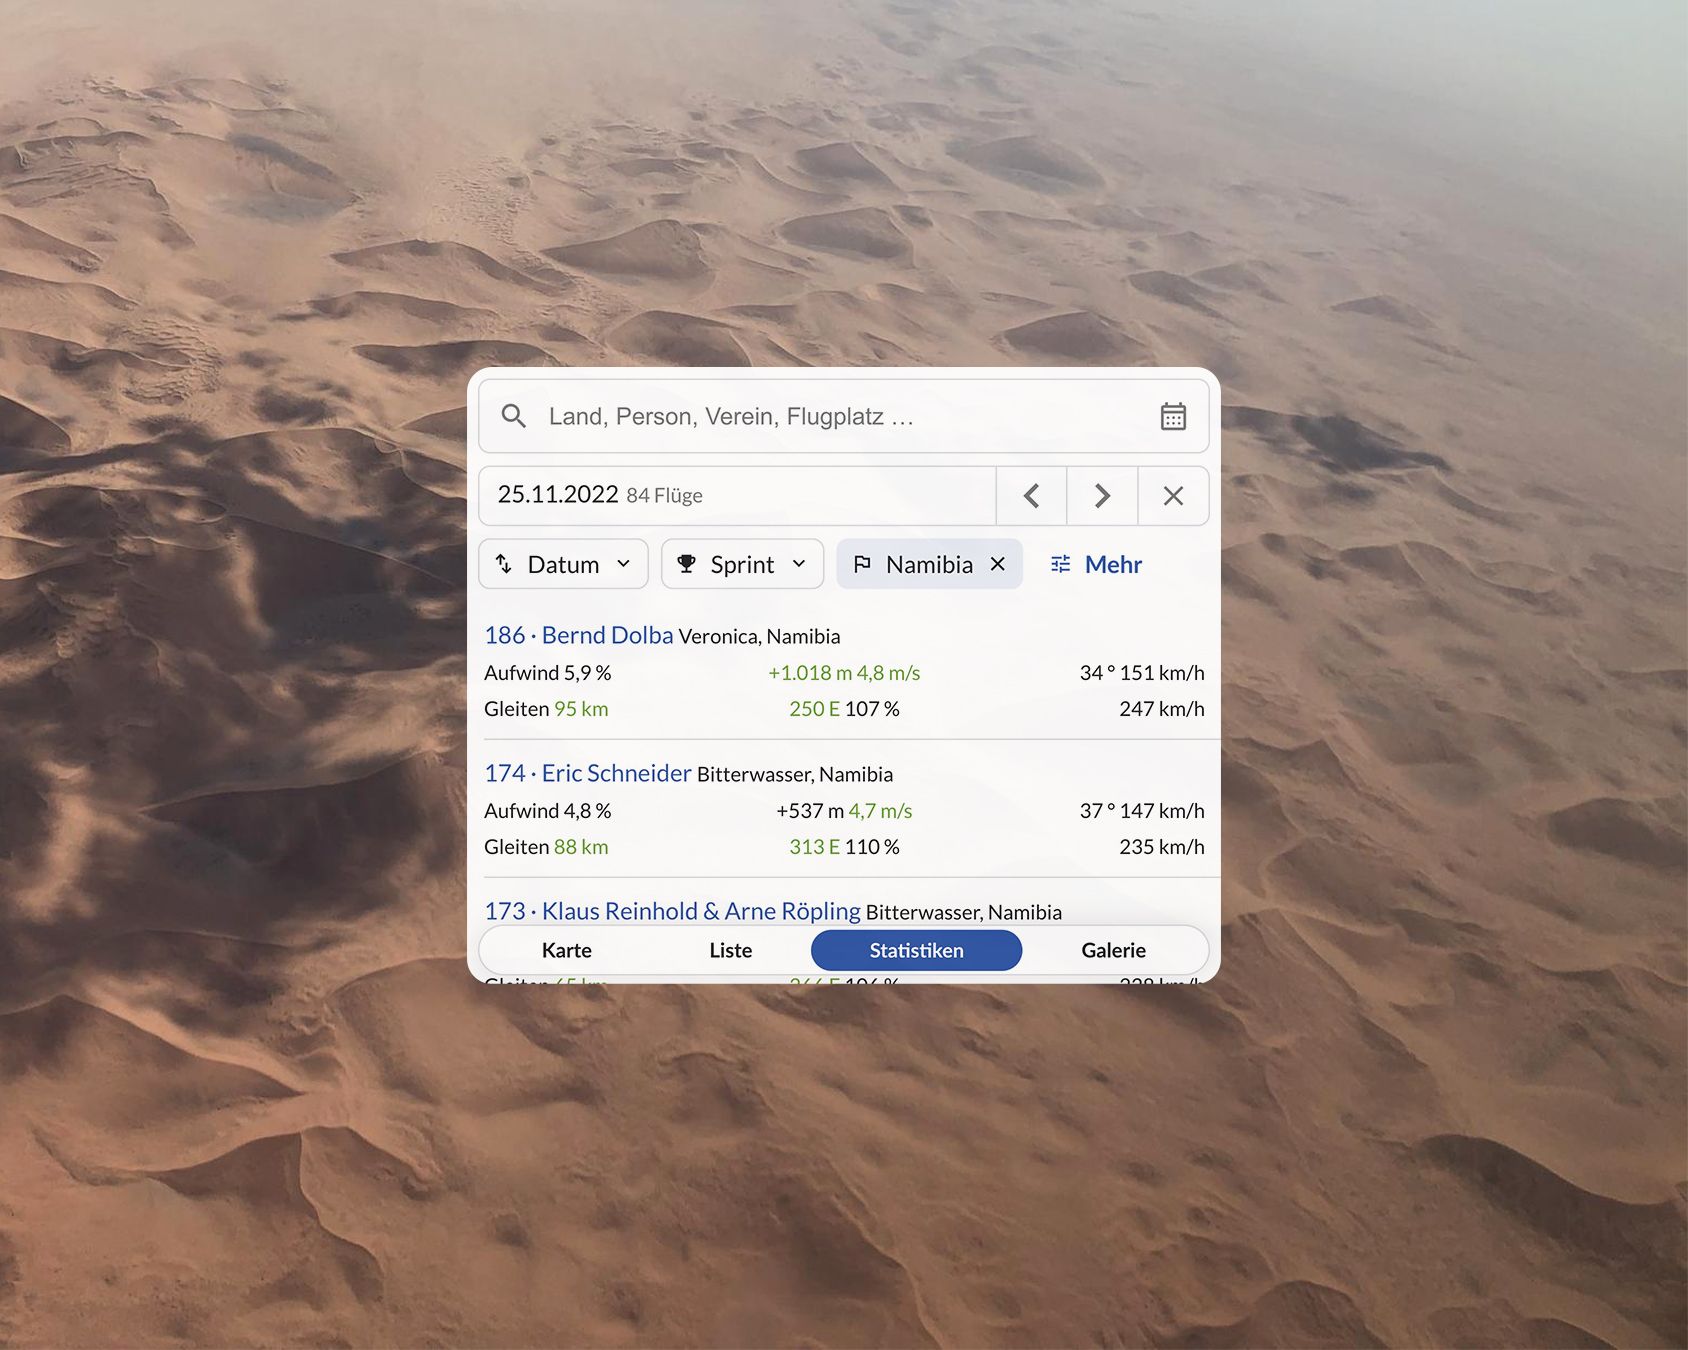
Even if Eric Schneider had the better glide on average, an enormous thermal over 1000 meters combined with a slightly faster cruise speed could make up for that.
Earliest Starts Before 10 A.M.
Even in Namibia, you have to leave early if you want to do a big flight. The days are short. Every evening at dinner, all pilots hope that the wind will not blow too strongly from the west. If that is the case, the sea breeze has a big impact, which does not bode well for an early start the following day.
In the WeGlide Magazine there is an insightful article about the Namibian weather together with meteorologist Bernd Goretzki:
What was the earliest take-off, and when did the highest-scored flights take off? There were a total of three take-offs before 10 a.m. local time. The earliest started at 9:54 a.m. from Pokweni and ended at 1000 kilometres. All starts before 10 a.m. and occurs in December. Note, the third-earliest start (09:58) was the 1000 km via car tow from Veronica.
The top ten flights (all above 1400 points) took off at 10:16 a.m. on average. The highest pointed flight of Maximilian Schäfer & Eva Schröder at 10:01, but also a flight of Tobias Welsch & Max Mensing 40 minutes later. So there was a decent margin and, of course, much more contributes to a great flight. Enormous thermals for example.
7,6 m/s Integrated
Quite often, we look euphorically at the integrator while flying and are brought back down to earth after the flight by the phase analysis - the thermal was just not that strong on average. All the more impressive are the following top climb values of the last Namibia season, integrated over the complete altitude:
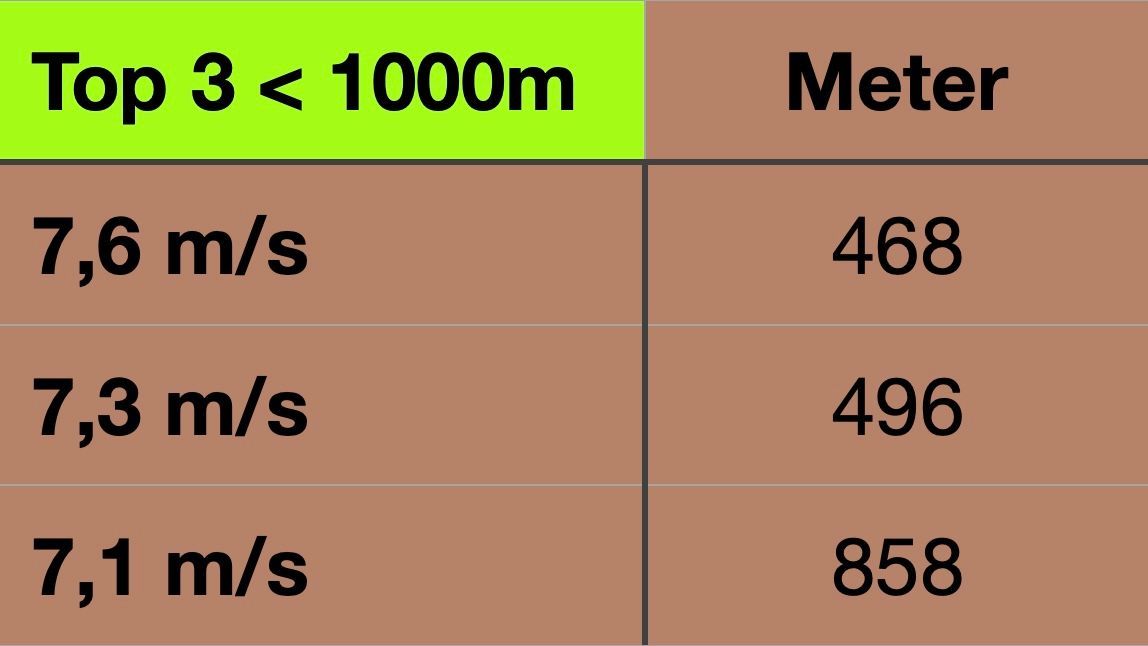
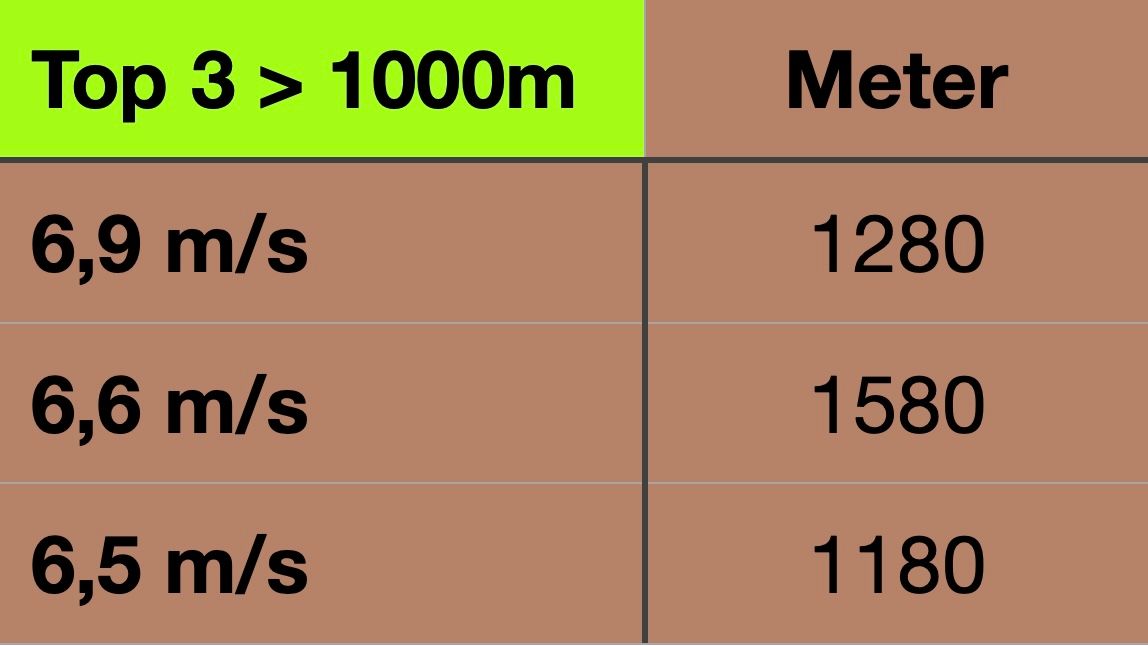
Two of the top six climbs were on the same day, the 25th of November. In addition, two of these climbs were from the same pilot. Klaus Wonneberger of AC Schwarzheide seems to have a good nose for strong thermals.
The Best Days
On the 22nd of November, there were the most uploads (35). However, this was not the highest-scored day. If we have a look at the top 3 days here, the first thing that stands out is the distribution: All months of the Namibia season had one of these days ready for the pilots.
Leading the way is the 28th of November with just under 34,000 points, followed by the 31st of December and the 08th of January. These two days also brought well over 30,000 points. However, not every day had the same number of scored flights. Averaging the uploads, the 31st of December emerges as the best, with an average of 1052 points per flight.
1052 points stand out clearly, but not extremely, from the seasonal average of 809 points. Here it becomes obvious once again that the points are not easy to earn, even in Namibia. Flights far above 1000 points are still an enormous achievement here - congratulations to all pilots!
Finally, we took a brief look further back into the past. In short, the 22/23 season was significantly stronger than in 21/22. Only 918 flights were uploaded back then. 600 flight difference says a lot. We look forward to continuing this statistic in the coming years. Let's see what the current season brings. We wish all pilots a lot of fun in Namibia!
If you want to receive articles like this directly by email, you can sign up for it in your profile:
 Joshua Rieger