NEW | Thermal Hotspots in WeGlide Copilot

Who doesn't know the problem when gliding? Blue skies and you're trying to find the thermals looking at significant areas on the ground. Or you get low on a hammering day and your attention turns away from the clouds to the terrain to find the thermal that will save you. You look out for forests or small mountain ridges. Always in mind that some places only work well in the morning and others need a light breeze from the west.
Everyone knows thermal hotspots at their home airfield. But what would it be like to see every place like the back of your hand?
Every day we get valuable data from you and can realize our vision. Optimized data from glider pilots for glider pilots, perfectly tailored to your use case.
The idea of thermal hotspots is nothing new. However, updrafts for paragliders are often not usable for us and can be misleading. Data from us glider pilots is only sometimes valuable, as well. Our top priority is to only provide you with high-quality data.
Introducing Hotspots
The maps will initially only be available for Central Europe. Why? More on this later.
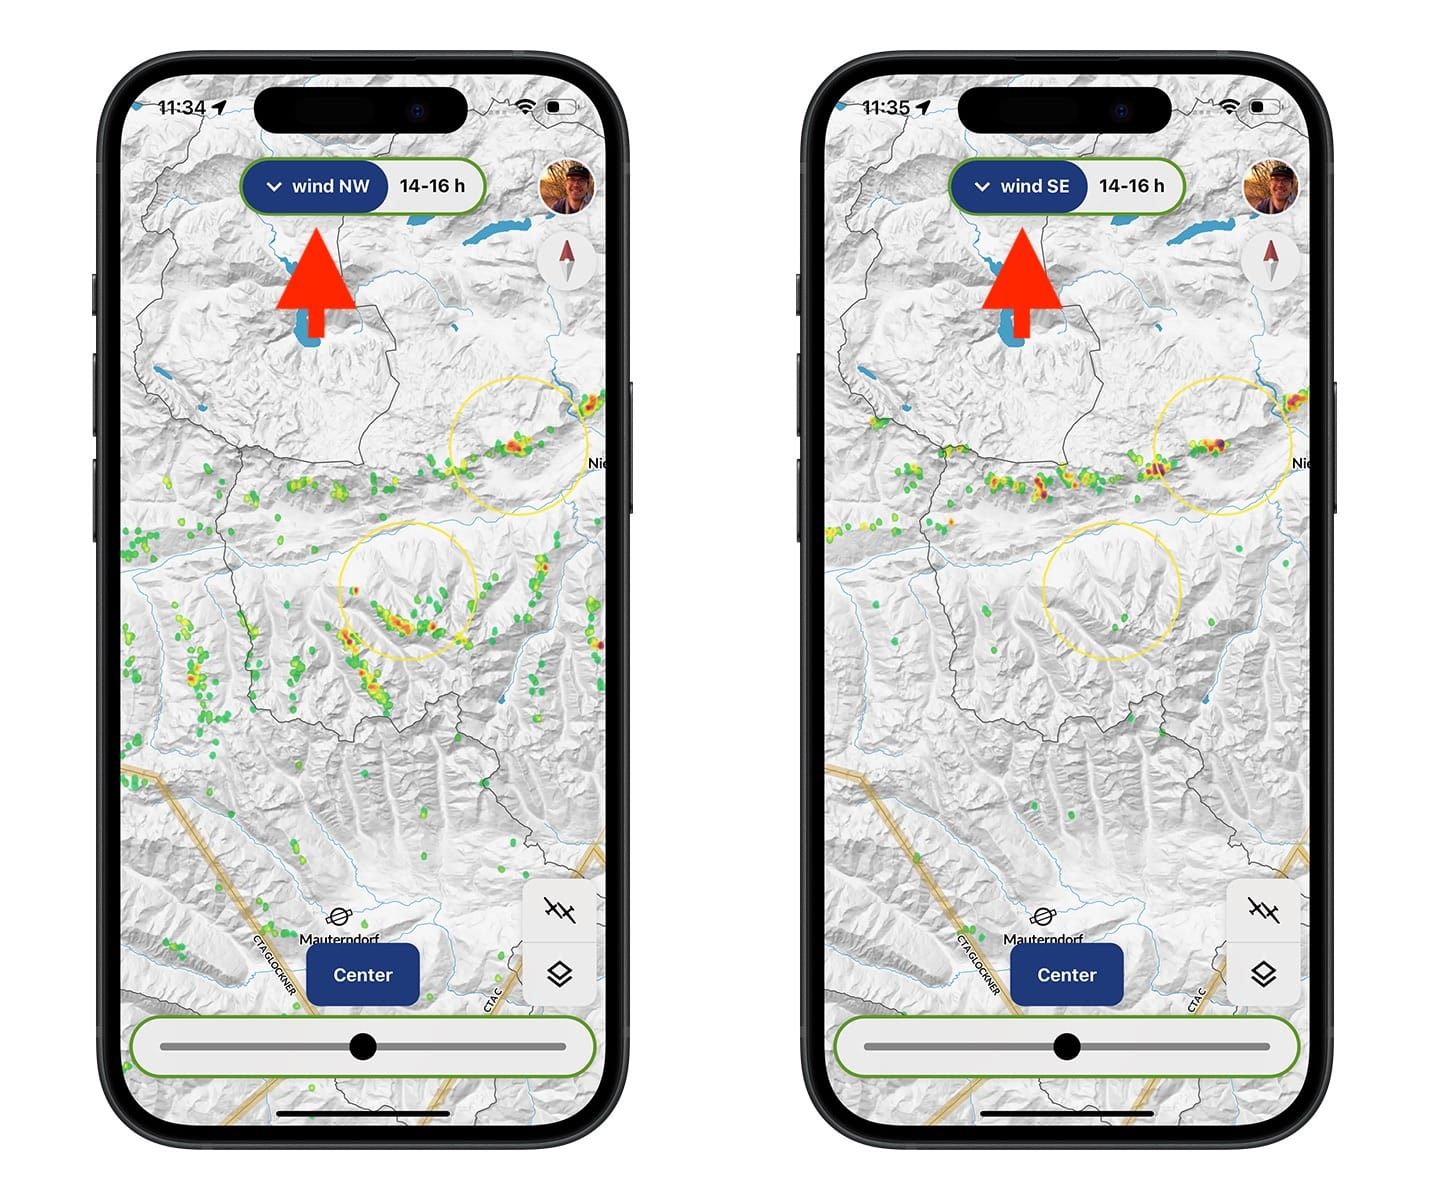
Our hotspots are not a single map. Rather, you can choose between five time steps and five wind directions. In total, there are 25 different maps. This ensures that we provide the best possible hotspot map for every phase of the flight.

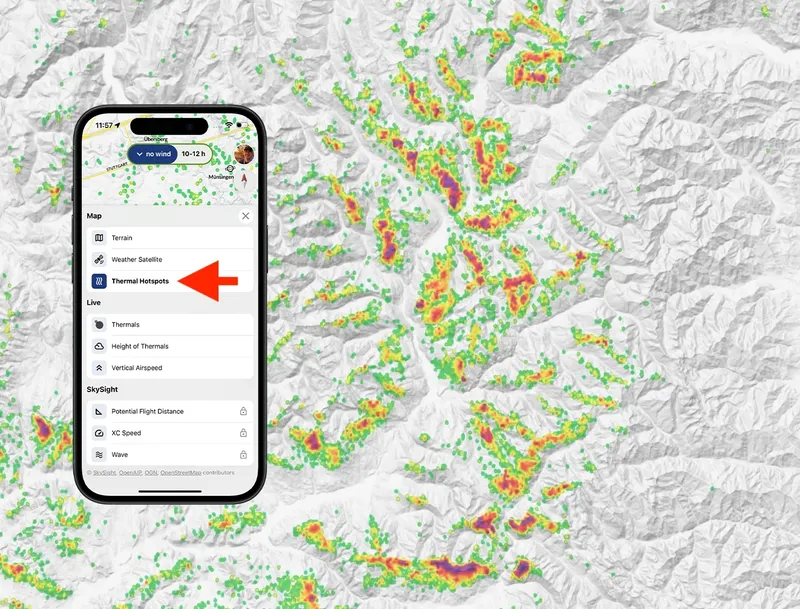
You can now use the hotspot maps while flying with the Copilot App (subscription required). Make sure you have downloaded the current version by clicking force update in the settings. Never heard of the WeGlide Copilot App? You can download it at the following link. Copilot is available for Android and iOS and includes many useful features to support you during flight.
In an ideal world, a hotspot map would show the probability of a particular point generating a good hotspot. All available factors such as wind, time of day, humidity, time of year, and much more would be taken into account. The focus of the WeGlide hotspots is on wind and time of day. We are convinced that these have the greatest influence.
Over ten million thermals have been analyzed by the team. Data, you uploaded to WeGlide. It would be a naive approach to cluster the thermals and display their number in color. Glider activity is higher in some areas, especially near airfields. Therefore, a map showing how many gliders were cranking at a particular point would not be very helpful.
What the Map Shows
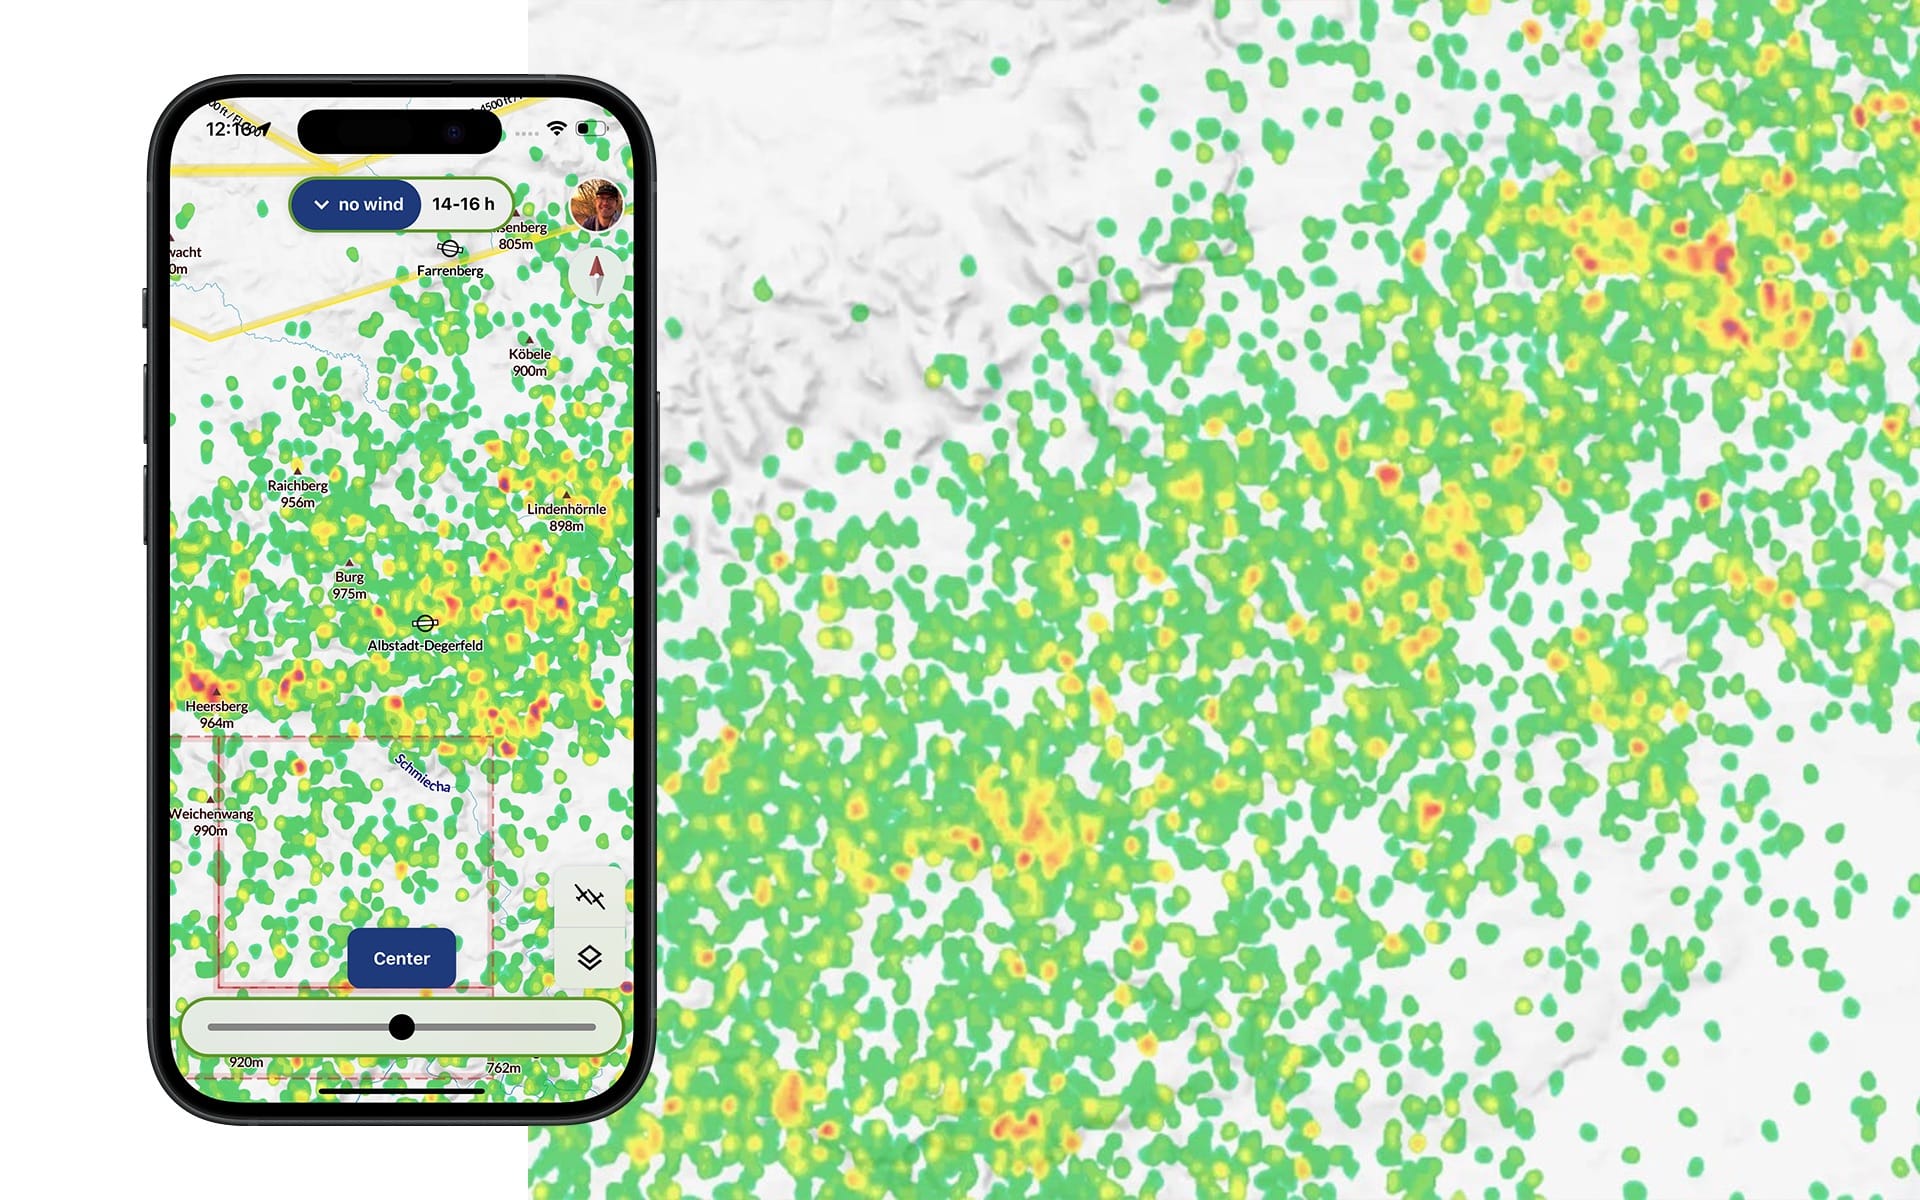
The color on our hotspot maps indicates your chances of finding a good thermal. Algorithms are used to optimize this procedure. If a dot is visible on the map, the probability of finding a thermal will be much higher than in a gray area. The brighter the color of a dot, the better and more reliable the thermal should be.
Our tip: If much data is available (such as in popular areas at midday), the yellow or red areas should be targeted. If there is less data (early morning or the evening), even a single green point is statistically the best chance of finding a thermal.
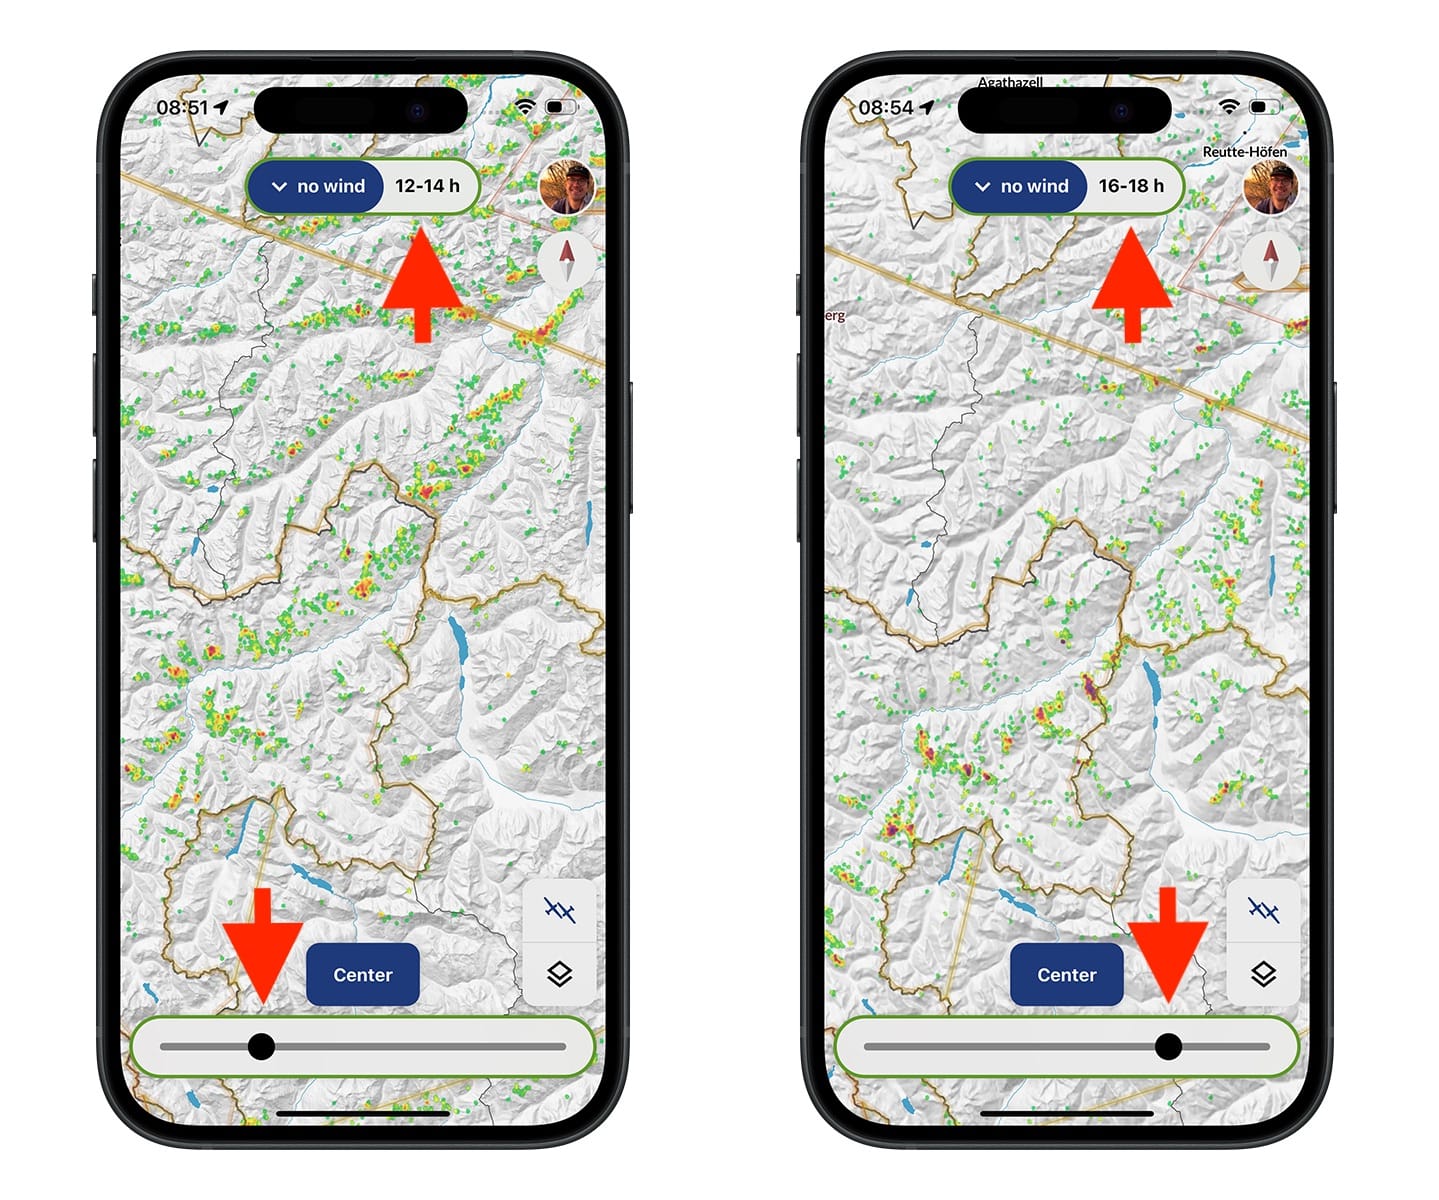
In the picture above you can see that the east side of the Engadine produces the best thermals in the evening, while you should choose the other side at midday. Like our satellite images, you can change the time using the slider (below).
It is a pleasure to study the different maps with Copilot. Once again, we have placed a special focus on simple and intuitive usability. You can now easily see how the time of day and the wind influence the different hotspots.
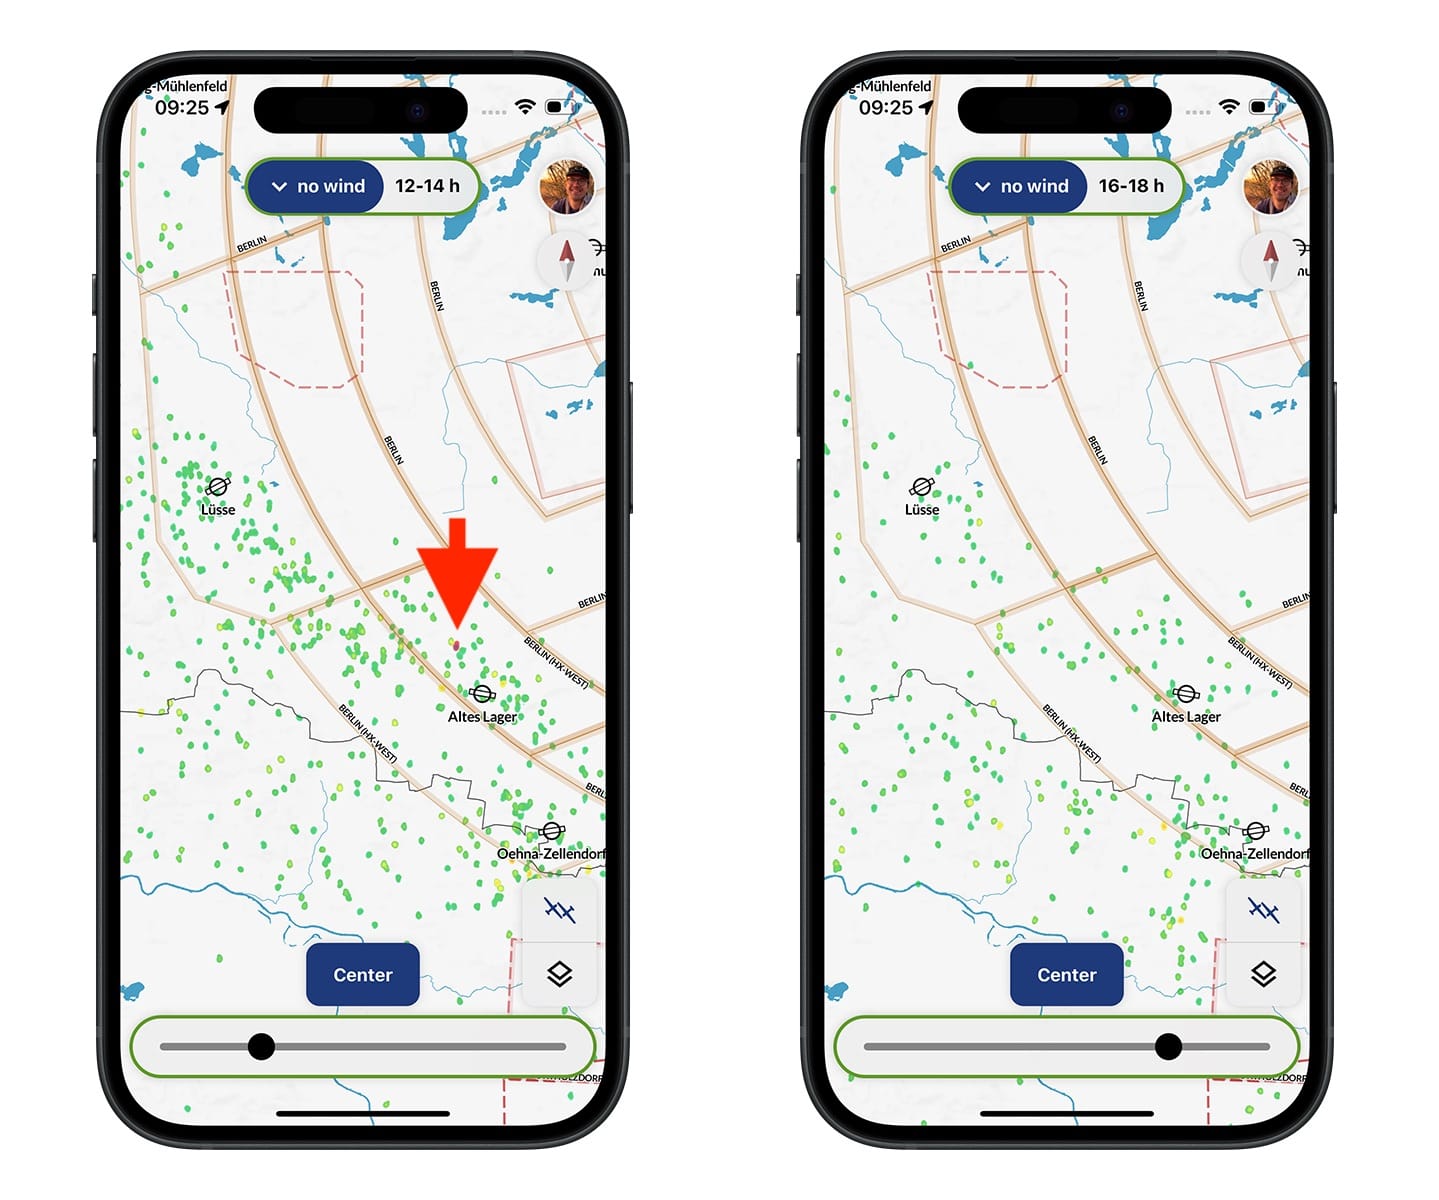
Similar patterns can be seen in the flatlands. The picture shows hotspots to the west of Berlin. At midday, there are significantly more of them north of the state border, while the density is similar towards the evening. What is particularly impressive is that there are also very reliable thermal sources in the flatlands (red dot, north of Altes Lager), which we would only have expected from the Alps or power plants.
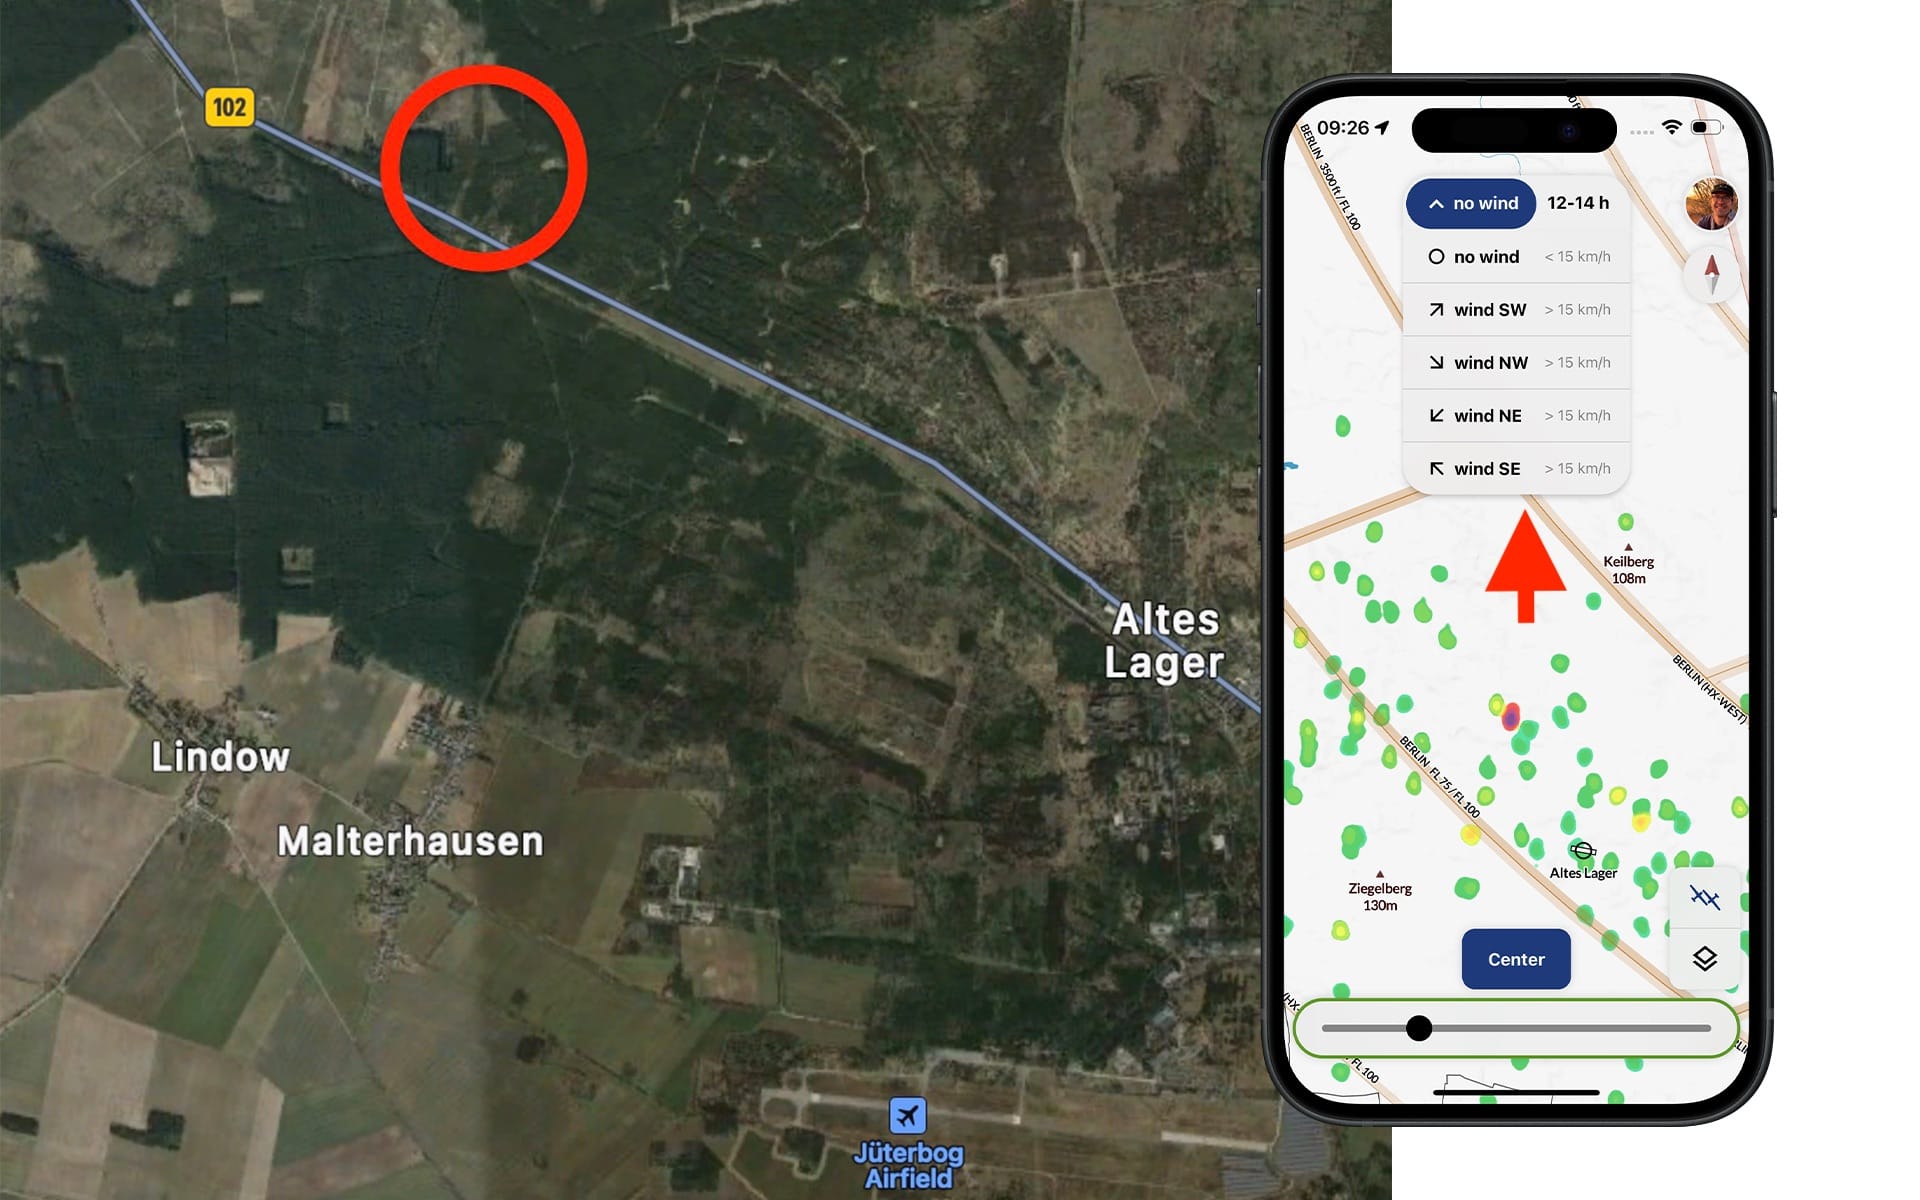
Looking at the satellite image, we could not find prominent triggers apart from forest edges (red circle). But that's exactly what our hotspot map is all about - making reliable thermal sources visible, which you wouldn't recognize without enormous local knowledge.
Our tip: If you press the wind button, you can choose between the different wind directions. After extensive testing, we recommend disregarding the wind up to a wind speed of 15 km/h (no wind button).
How Hotspots Help You
During the development, our team members tested the maps in flight. It became clear that the hotspots could be quite useful in many situations.
Johannes
I recently took part in a competition. Before the start line opened there was blue sky all over the place and everyone was circling to the south of the airfield. I flew in the opposite direction. Every time I approached a colored dot on the hotsopt map, the vario went up.
Moritz
It's always interesting to fly back to Nastätten from the Sauerland in the evening. You leave a very good area and have to use the last thermals to get home. On my last flight I used the hotspot maps to follow the exact lines of the good hotspots in the evening (depending on the wind/time of day). I found a good updraft this way. More importantly, however, I was able to significantly increase my glide ratio, as i was often in good air at the colored points.
Nuno
I took part in the Hahnweide competition. Especially when we got lower and the clouds were too high to use as a thermal indicator, I used the hotspot maps to increase my chances. I didn't know the area very well beforehand and the maps gave me a lot of confidence in hitting the right spots.
What Comes Next?
We have great news for all our users. The maps will soon be added to the flight page and the task planner. So you can also use the hotspots to plan and analyze your routes in the future. On these pages, the maps will be freely accessible to everyone.
It has taken a very long time to perfect the features in our Copilot app. We would like to thank everyone who has already supported us with a subscription. The hotspot maps are a great example of how our subscribers allow us to invest a lot of time in developing a feature that ultimately benefits everyone.
The hotspots are currently only available in Central Europe. We want our maps to be reliable. This requires an enormous amount of data. As more and more flights from all over the world are uploaded to WeGlide, we will extend the hotspot maps to other areas, soon.
Tell your friends about WeGlide and motivate them to upload. The potential of your data is far from exhausted. Let's take the next step together.
If you would like to receive articles like this directly by e-mail, you can register for this in your profile:
 Joshua Rieger