Announcing the WeGlide Coach

With each flight, we try to get a little better at gliding. We want to understand how nature plays and in return improve our decision-making process. To get better we need a coach, a person who can tell us how we can improve. Sadly, we don't always have someone sitting next to us who helps us to analyze our flight.
Today, we are announcing the WeGlide Coach. A new analysis feature that scans your flight and gives you data and tips, on what you should do differently. The coach is made up of three new features:
Speed to Fly Analysis, Weight Analysis, and Thermal Analysis. They will help your decisions regarding three problems:
How fast should I fly between thermals? How heavy should I fly? How tight should I circle?
Speed To Fly Theory in a Nutshell
MacCready Theory teaches us about the optimal speed to fly at any point in your flight. For any aircraft's polar, net air movement and expected climb of the next thermal, there exists an optimal speed to fly. It has two basic principles:
- If thermals are powerful, it is worthwhile to fly faster between thermals. You'll arrive lower, but also earlier, and with a strong thermal, you can make up the altitude much more quickly.
- If the air is rising, you should slow down to spend more time in the lift. If the air is sinking, you should speed up, to spend less time in the sink.
Even pilots who do not exactly follow the speed-to-fly theory will stick to these principles. If they don't, they will have a hard time keeping up with you.
Speed To Fly Analysis
WeGlide provides a lot of statistics for your flight. How fast you were flying. How many attempts have you had? How big your bank angle was when circling? Up until now, you needed to interpret these numbers yourself. But why not have WeGlide do the work for you?
The only thing you need to do is enter the weight of your aircraft. With this information, we evaluate the polar at each point of your flight to calculate the net air movement. Using information about the wind during your flight, we calculate the Indicated airspeed (IAS) at each moment.
Optimal Speed To Fly
Let's have a look at the analysis of my last flight. Per default, the whole flight is analyzed. We see a comparison of my average IAS (146 km/h) with the optimal speed calculated with speed to fly theory (160 km/h) using the polar of the LS 10, my weight of 540 kg, and the net air movement.

As you can see, I was flying a bit too slow between thermals. Of course, there are many cases where it makes sense to fly a bit slower than speed to fly theory suggests. For example, if the cloud base is low, and you are very uncertain about the next thermal and want to minimize your risk of landing out.
Therefore, the colored areas are defined as:
- Green: From 8 km/h too slow to 4 km/h too fast.
- Yellow: From 8 km/h too slow to 16 km/h too slow and from 4 km/h too fast to 8 km/h too fast
- Red: More than 16 km/h too slow or more than 8 km/h too fast.
The analysis shows that I was in the yellow area, so I could try flying a bit faster between thermals next time.
Speed Areas
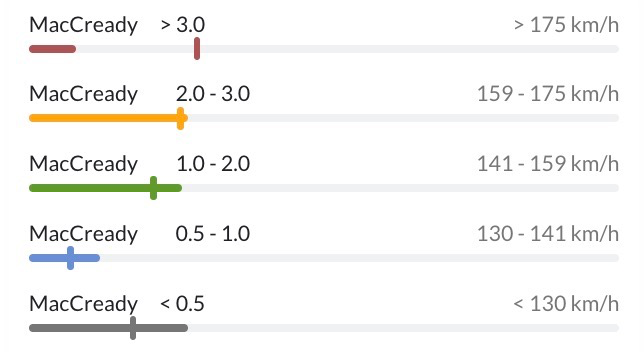
Now I know that I am flying too slow between thermals, but I don't yet know when exactly I should fly faster. Luckily, Speed To Fly Analysis also shows the time spent in each speed interval (horizontal bar) and the optimal value (vertical bar).
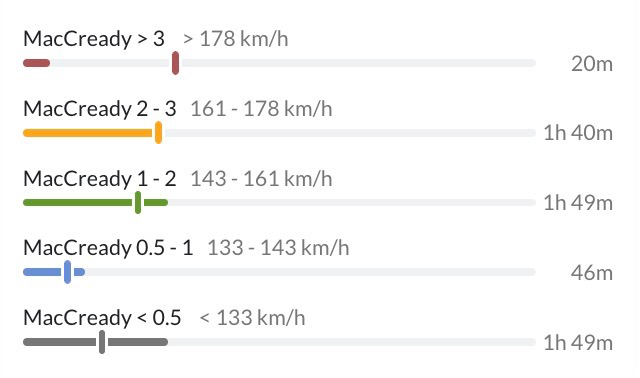
On the left side, you see MacCready values and next to that, you see the associated speeds for the aircraft, in this case, an LS 10 with 540 kg. For example, if I expect the next thermal to be 2 m/s, I should fly 161 km/h in calm air.
You can see that I had some good climbs and should spend more time flying above 175 km/h. Also, I spend too much time flying below 130 km/h.
Weight Analysis
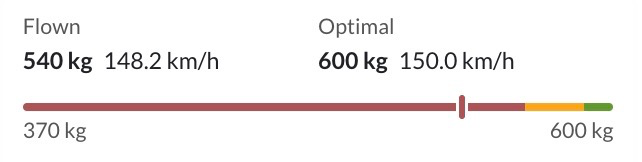
Together with Speed To Fly Analysis, we are also introducing Weight Analysis. As we calculate the net air movement for any point of your flight, we also simulate how your flight would have turned out with a different weight. We simulate the time you would lose in thermals when flying heavier and the time you would gain in straight flight, and use this to calculate the optimal weight for your flight.
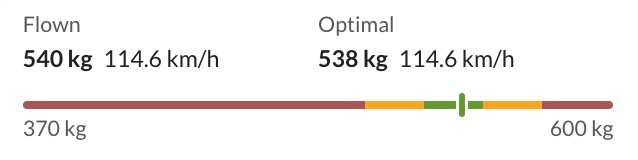
As you can see, the pilot was flying with 540 kg, which is pretty close to the perfect weight for these conditions. This feature will help you better understand how much water you should take with you in which conditions.
Choose Your Interval
The best thing about these new analysis features? They adjust exactly to the different intervals you want to analyze.
Different Contests
If you click on the sprint contest, you see the analysis of the fastest two hours of the flight. The weather was a bit better, and I was flying faster between thermals compared to the whole flight, but the optimal speed was also a lot faster.
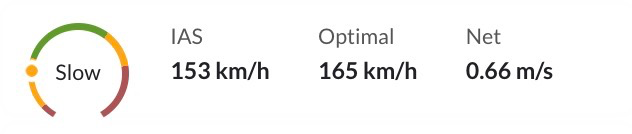
Also, in the sprint contest, I could have been almost 2 km/h faster if I had flown with the optimal weight of 600 kg.
So if I'm optimizing for just the sprint, I should take more water with me. At the same time, it's interesting to see that those extra 60 kilograms would only bring me around 2 km/h more, whereas one bad decision can easily cost me more than 10 km/h.
Individual Legs
You can also click on individual legs, which will then be analyzed. For example, in this case, the analysis is for the first leg of the Free contest. There were some excellent lines (0.7 m/s net on average), but I was flying a bit too fast.
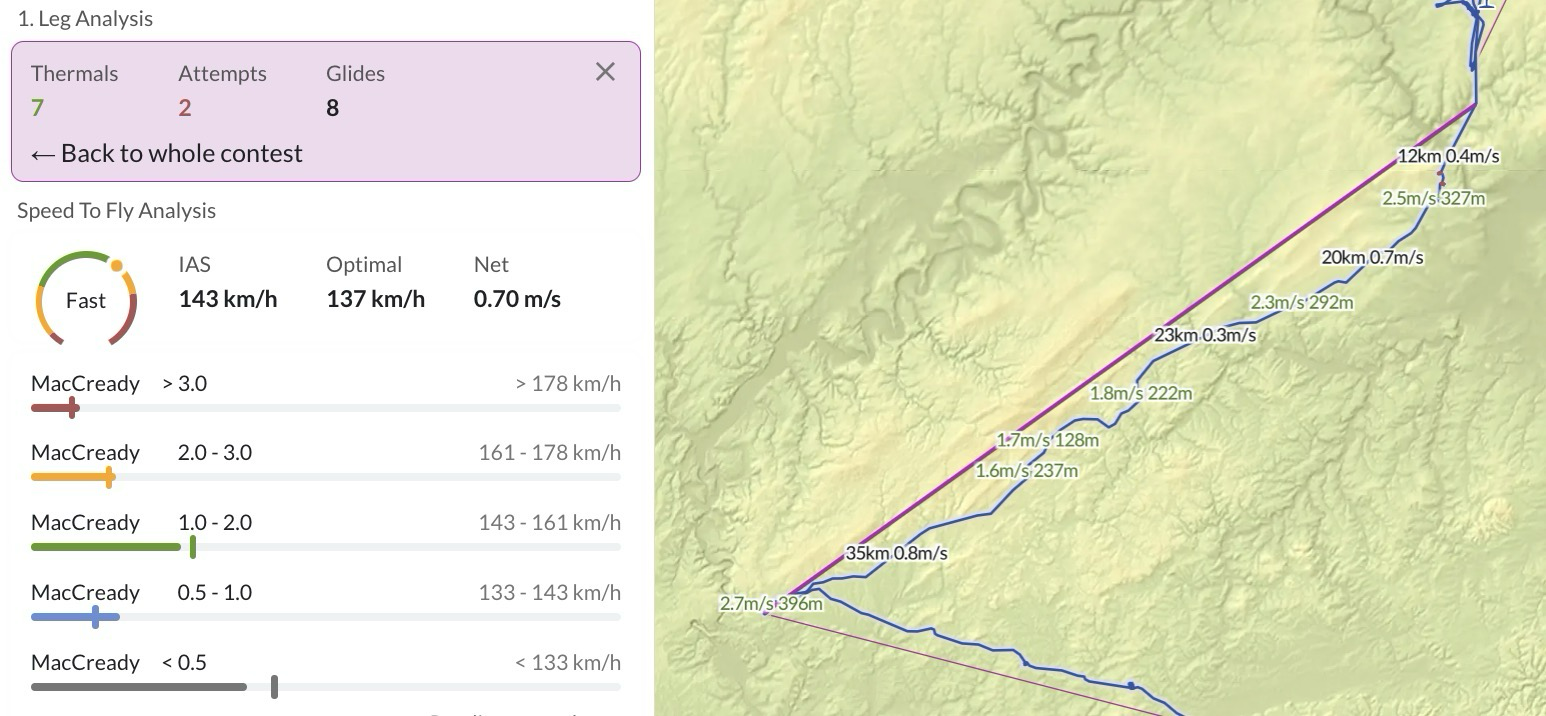
You can cycle through the legs and understand exactly where you flew too fast and which conditions require how much water.
Single Glide
But what if I want to know the exact details of a single glide between two thermals? Just hover over it in the barogram. Also, the length of the glide and the net air movement is now displayed on the map.
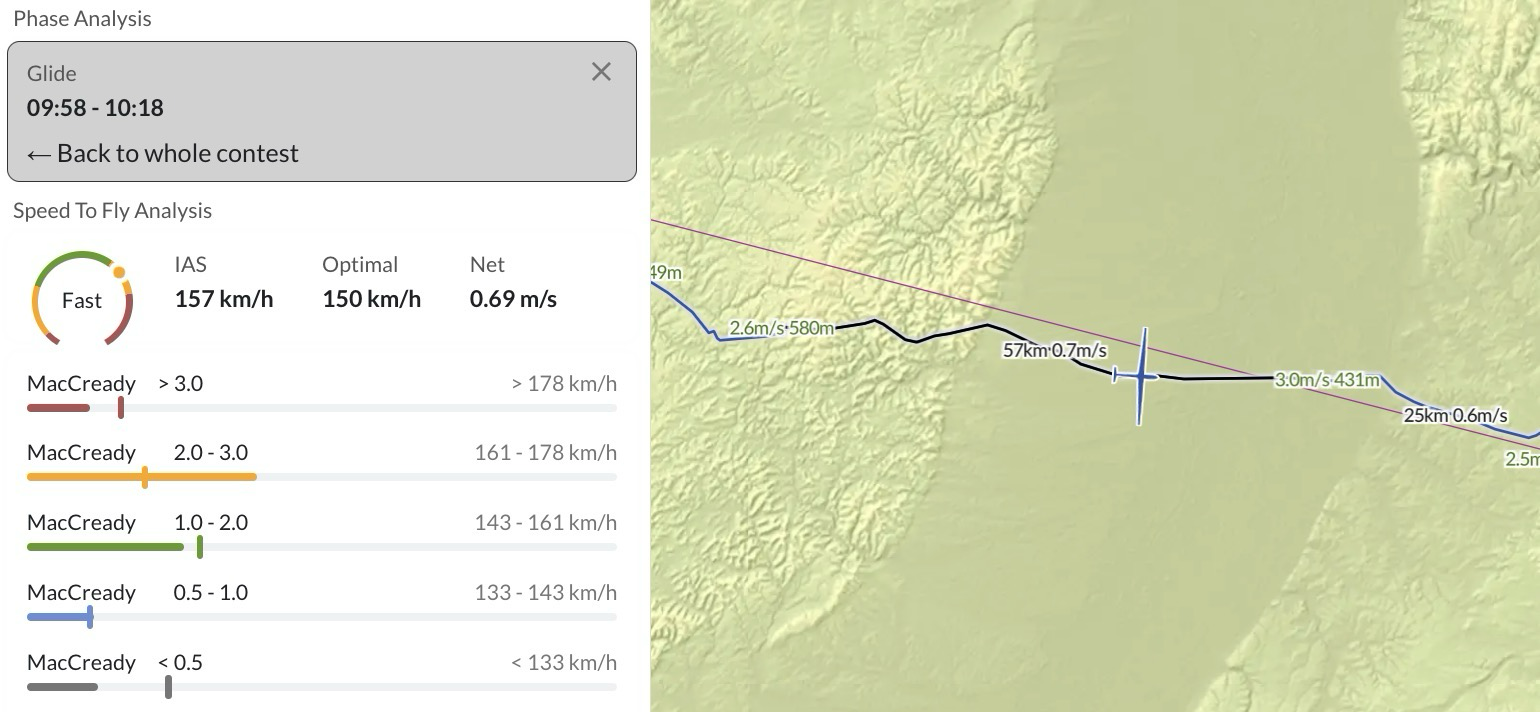
I found myself using this feature a lot to compare different routes that people took. It works better than the glide ratio, as the glide ratio will increase if you slow down and also depends on the aircraft. The net air movement lets you compare who took the better line and at the same time tells you how good the weather was.
If you find a flight that averaged greater than 1 m/s net, the air really must have been burning.
Thermal Analysis
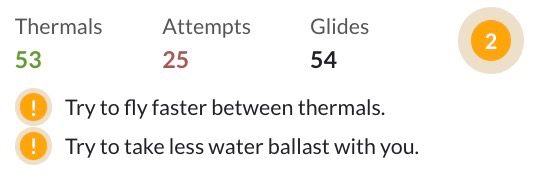
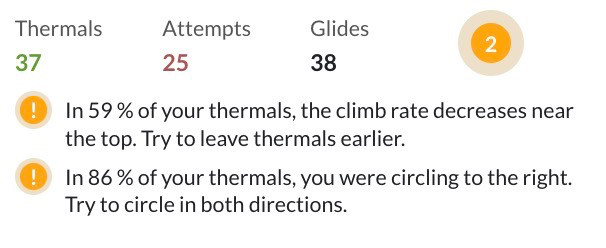
If you select a thermal in the barogram, it will be analyzed in more detail. Climb Analysis focuses on two frequent errors: Not circling tight enough and leaving a thermal too late when the climb has already gotten weaker.
Thermal Radius
We calculate the radius of each thermal and give you a visual indication if you are circling tight enough. Based on many thousands of thermals, we calculate the optimal thermal radius depending on your altitude.

Leaving Too Late
To understand if you are leaving a thermal too late, each thermal is divided into five equal height ranges. The average rise is shown for each of these areas. We ignore the first and last 15 seconds, where you are still centering the thermal or are already about to leave it.
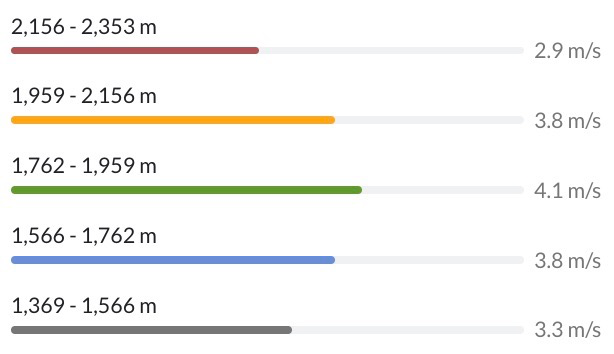
In this example, the climb becomes significantly weaker in the upper fifth - the analysis recommends that I should leave thermals earlier. The coach also gives suggestions if your always circle in one direction or you often leave thermals too late.
How It Works
This was one of the most interesting and challenging features, that we have worked on in the last year. We took a lot of time to make sure we designed a feature that is both, beautiful to look at and rich in information.
Speed To Fly Analysis
So how do we calculate the optimal speed you should be flying with? For small intervals of your flight (a few seconds), we calculate your True airspeed (TAS) using your ground speed and wind speed. Afterward, we calculate your IAS from the TAS. We adjust the polar of your aircraft using the weight you have entered and then evaluate it to calculate the net air movement for the small interval.
We calculate an expected climb (MacCready) value for every point in your flight. This is essentially the value of the next climb, but it also considers some more thermals from the past and future.
Once we have the net air movement, and the expected climb value, we calculate how fast you should have been flying. So in the end, for each point in your flight, we know your actual speed and the optimal speed.
We calculate the speed to fly of your aircraft in net zero air for different MacCready values (0.5, 1.0, 2.0, 3.0). These are the speed values shown on the right-hand side. To calculate the horizontal bar, we check how much of your time you spent in each area. Then, we calculate what percentage of the optimal speed is in each area - this is the vertical bar. If you were perfectly following speed-to-fly theory, the horizontal and vertical bars would always match.
Weight Analysis
As we know the net air movement of any point of your flight, we can calculate how the flight would have turned out, if you were flying a bit heavier or lighter. We assume that, when flying heavier, you fly a bit faster, just so much to keep the same glide ratio. In thermals, your speed and radius will also increase if you fly heavier, weakening the climb based on our internal thermal model.
We search all possible weights and look for the one with which you would have been the fastest.
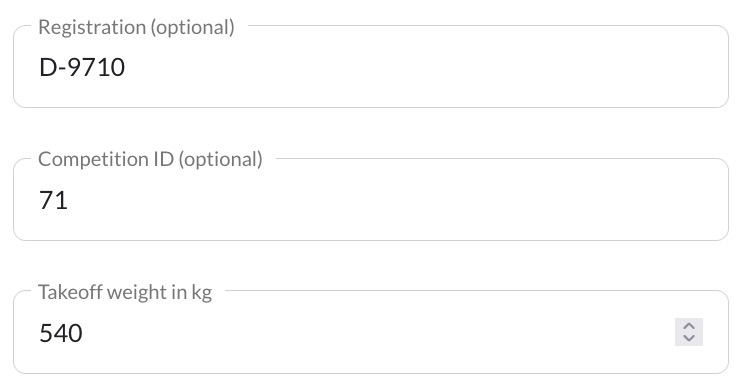
Set your Takeoff Weight
Of course, all of these analysis are only possible if we know the weight you were flying with. When analyzing flights, it is very important to know the exact weight.

You can set your weight directly when uploading your flight or afterward, by clicking on the pen symbol in the status bar on the flight page.
If you want to analyze the flight of someone else and guess the weight 50 kg wrong, the polar of the aircraft is very different. Therefore, the net air movement we would calculate would be wrong and we could not calculate the proper speed to fly.
Try It For Free
Speed To Fly Analysis and Weight Analysis are two of many more features that you get with WeGlide Premium. You can try the Premium subscription for two weeks for free.
By choosing a subscription, you support us. Support means we can further invest our time to improve WeGlide and build more features. If you already support us, thank you very much.
 Moritz Althaus