WeGlide Copilot | Real-time data on your phone

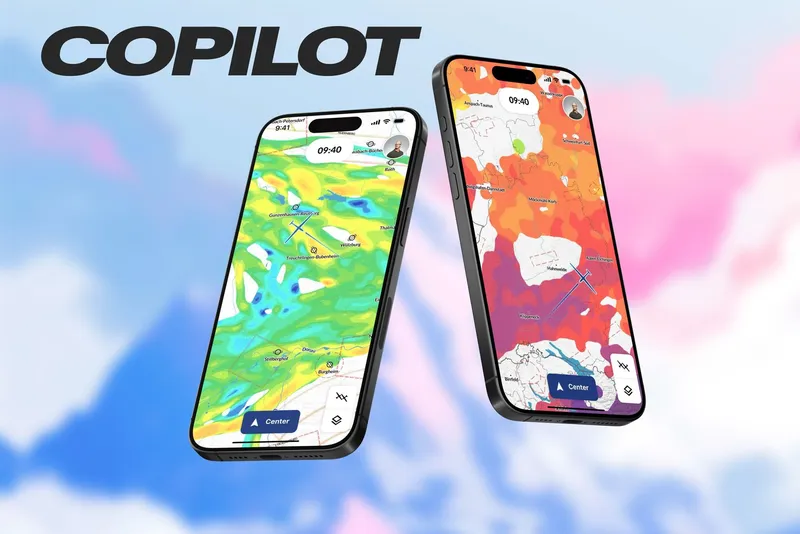
Finally it's official, there's a new app for the gliding world! WeGlide Copilot is a revolutionary tool that provides you with real-time data and analytics to improve your flight performance. Copilot bundles satellite images and SkySight forecasts with live updrafts, a real-time thermal height map and a map showing real-time vertical air movement.
In the air, we are exposed to a dynamic environment that contains an almost unmanageable amount of information. But our capacity to absorb information is limited. Only when the large volumes of data generated by a large number of other aircraft are processed and visualized by sophisticated algorithms do they represent huge added value.
Why ask your club mates on the radio what the weather is like when you can just look see it in WeGlide Copilot?
Reactions
"The WeGlide Copilot is the logical consequence of the increasingly active use of real-time data. We have made it our challenge to provide large amounts of data reliably when reception is spotty," says Johannes Dibbern, founder of WeGlide. "We also looked for new ways to visualize the information for you. This will enable you to make even better decisions in the future and get more out of your flight."
Moritz Althaus was a guest on the Thermal Podcast and spoke to Herrie ten Cate about the background and motivation for building Copilot.
And the first users are also delighted:
"WeGlide Copilot saved our final approach on our last flight", says Nils Fecker, one of the first testers: "Seeing the good lines in Copilot is an absolute game changer".
Live Vertical Airspeed
But what exactly does WeGlide Copilot offer? Have you ever wondered where the best lines are during a flight? We evaluate the current flight paths of all gliders and determine the air mass climb rate. The map is generated every two minutes and is based on the last 60 minutes. An ideal decision-making aid for long-term route planning on a leg.
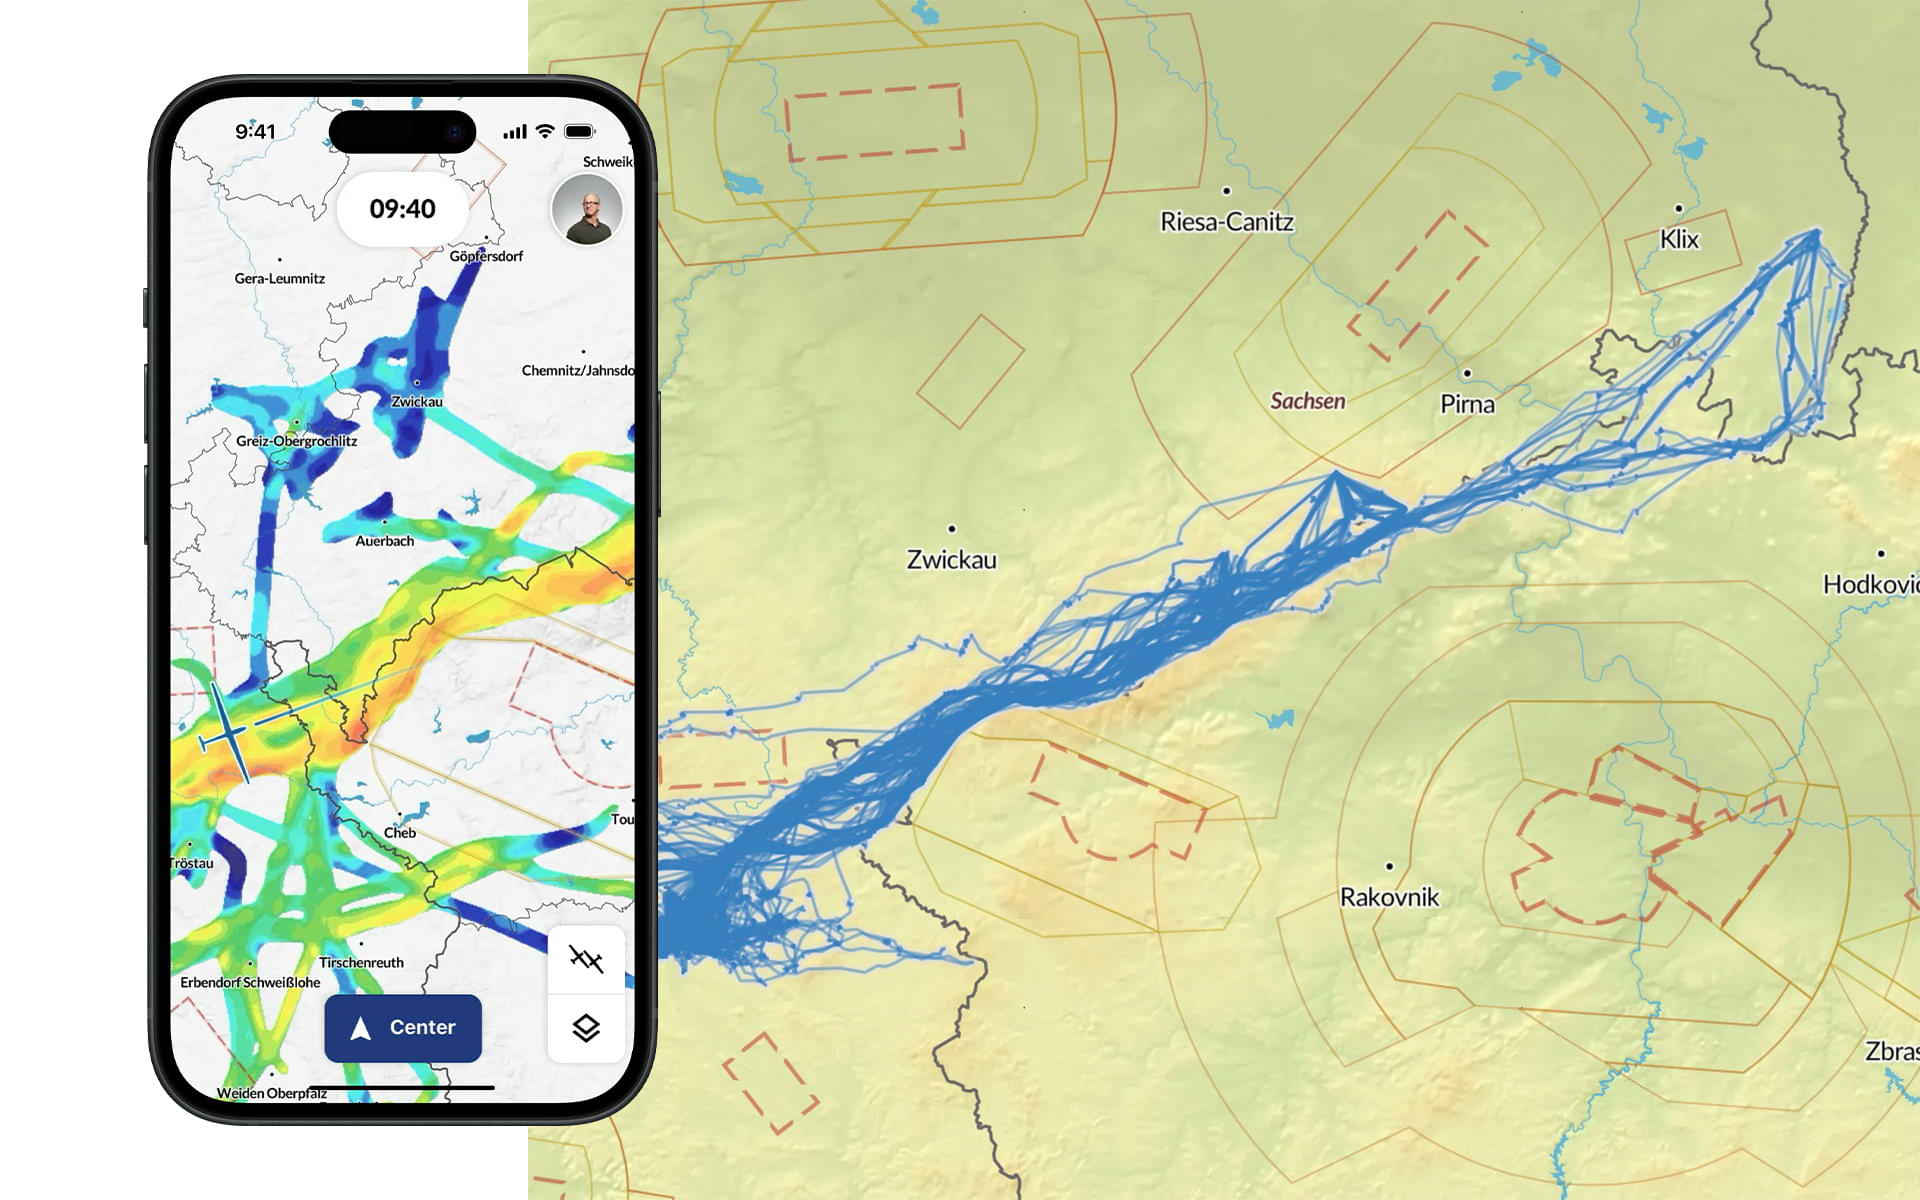
The picture shows the situation at the German Championships in Bayreuth with a task in the Ore Mountains (4th of June 2023). We have placed particular emphasis on the map high level of detail. Even in the good line, the best climbing areas can be identified and are clearly visible against the slower parts. If the participant had used Copilot in the cockpit, the choice would probably have fallen on the more southerly line. The tool is therefore not only ideal for long-term decisions, but also for optimization in the line.
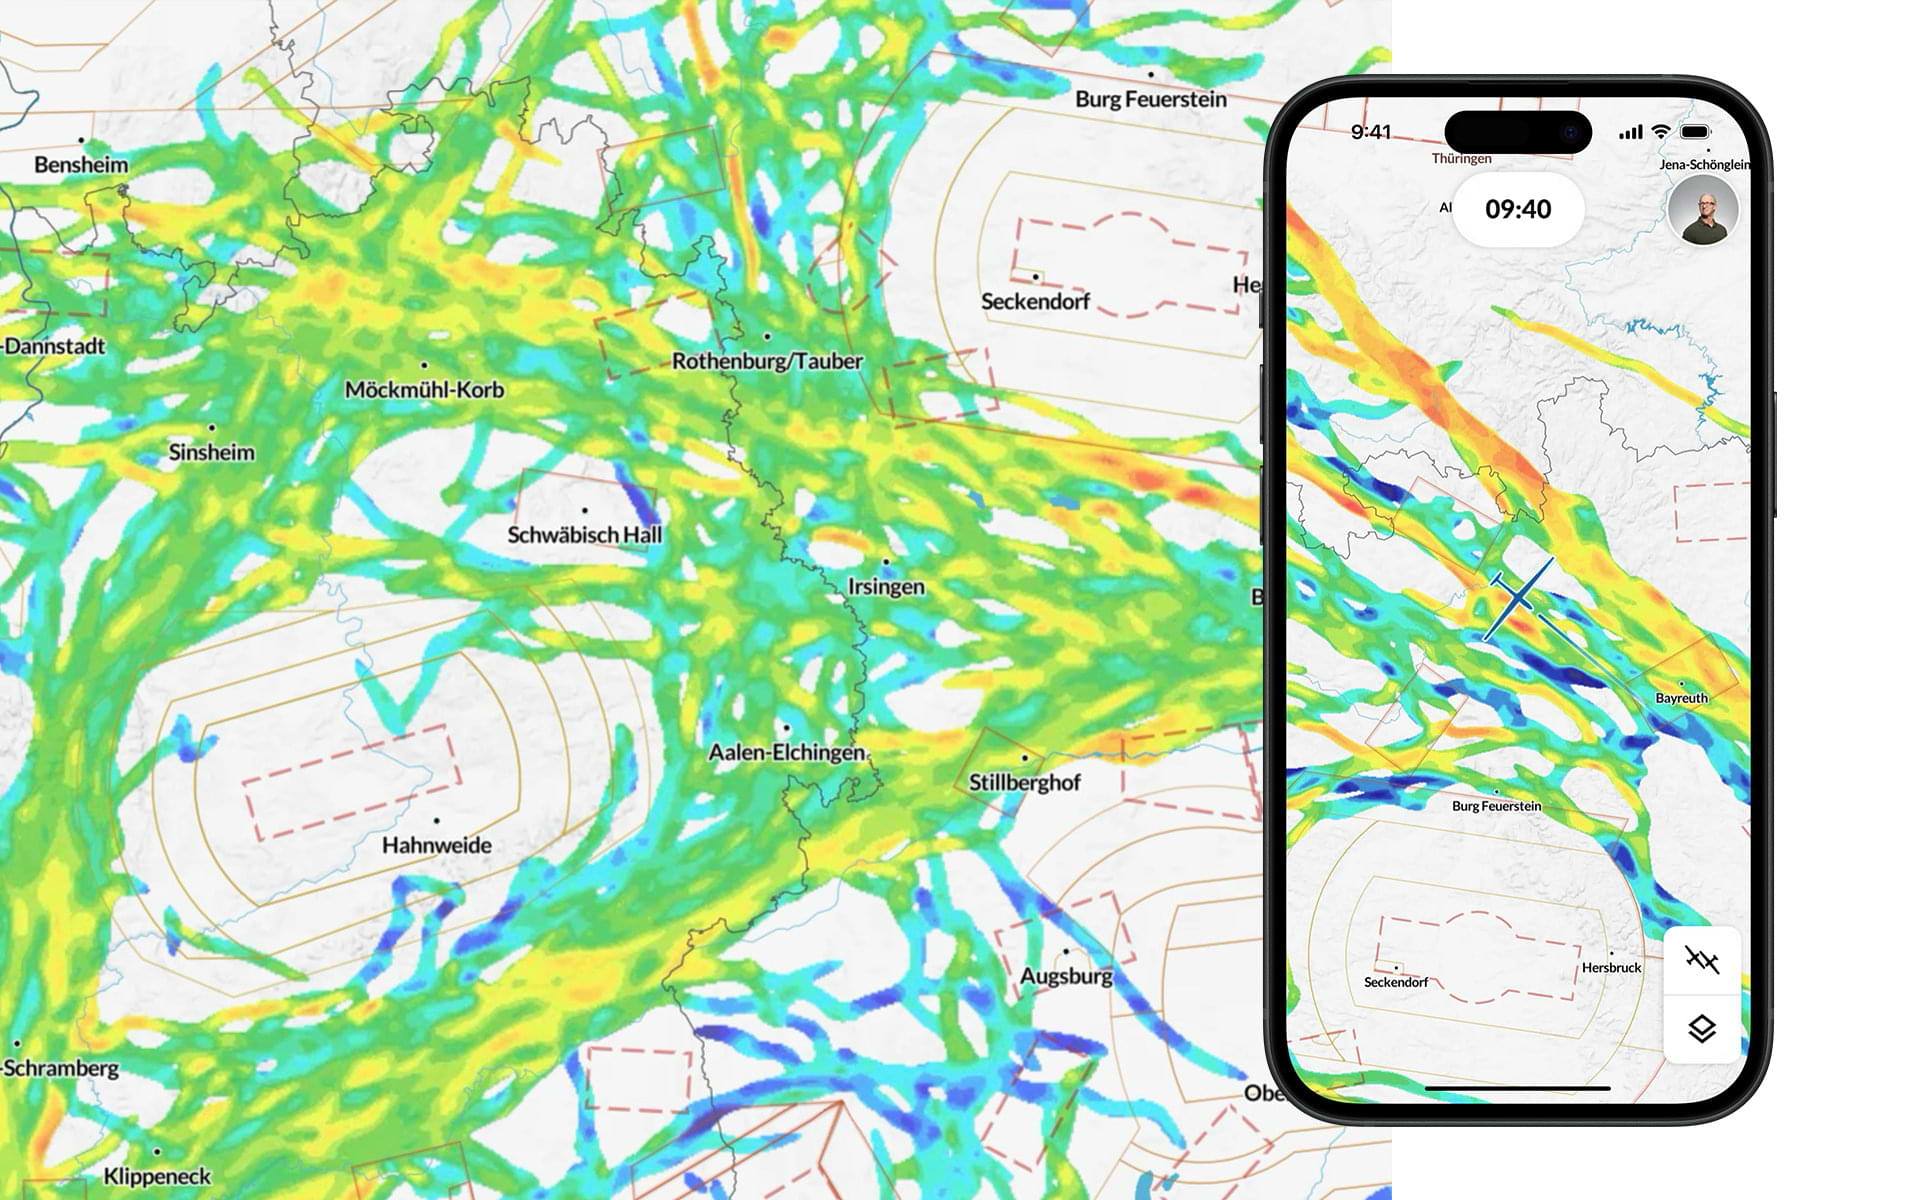
The more data there is, the more colorful the live net map becomes. Above, a moment from Saturday, 17th of June 2023 is shown. Good lines (yellow) are immediately recognizable on the Swabian Alb and south of the Odenwald. The Thuringian Forest (screenshot on the right) was also extremely good at this time. If he would have used Copilot, the pilot would certainly have opted for the eastern line.
Live thermal height
Here you get a clear overview of the current thermal height. As the thermal altitude usually correlates with the thermal strength (as long as there are no other disturbing factors), the map provides excellent information about the thermal quality in the different flying areas. This map is also generated every two minutes and is based on the last 60 minutes.
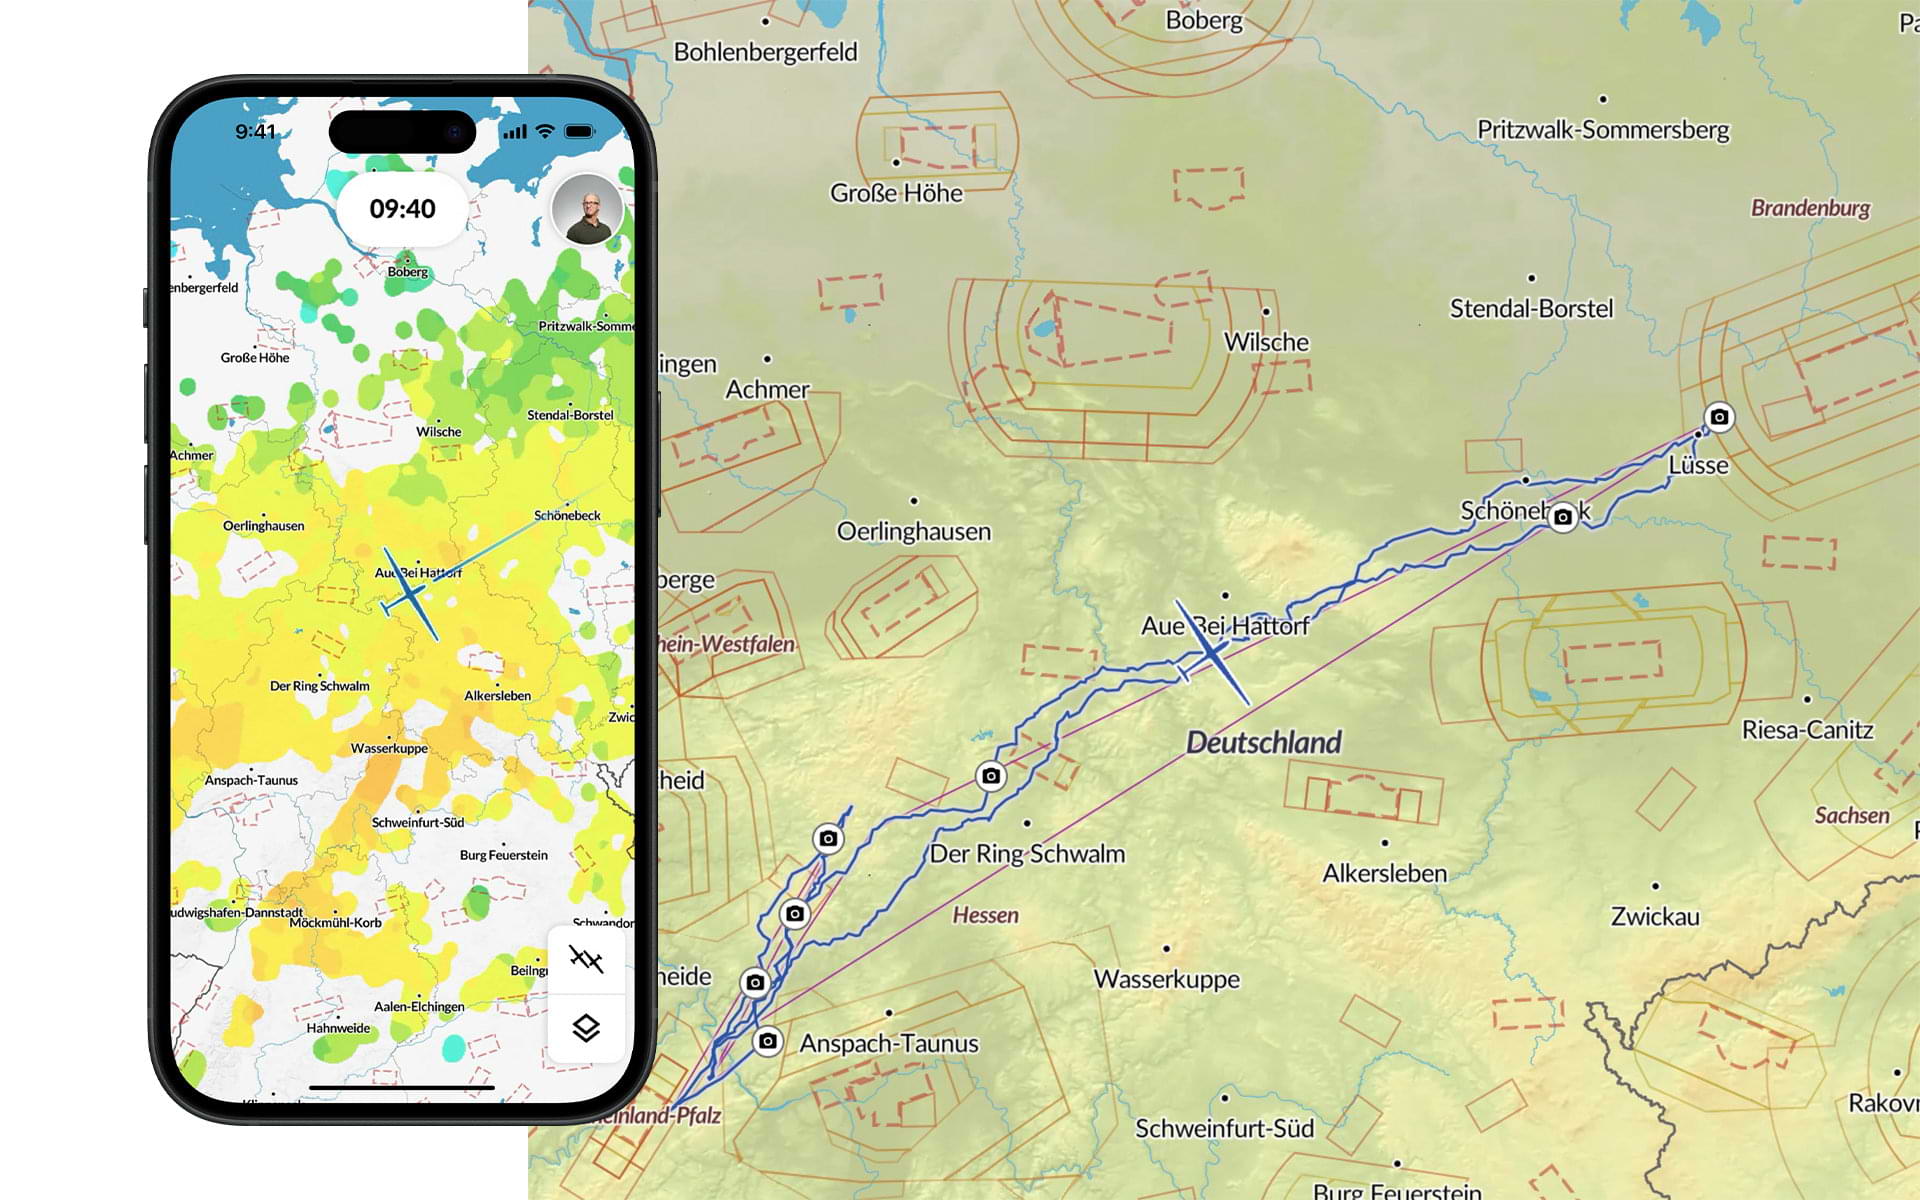
The picture shows 06.08.2022. Moritz from WeGlide made a flight to the Berlin airspace on this day. He reported a clear weather boundary north of Berlin. Copilot confirms his observation in the form of a lower base (green), long before Moritz could even make out the weather boundary with the naked eye.
Live Thermals
Never miss a thermal again? There have long been tools that display the climb around us. Copilot takes the upwind display to a new dimension.
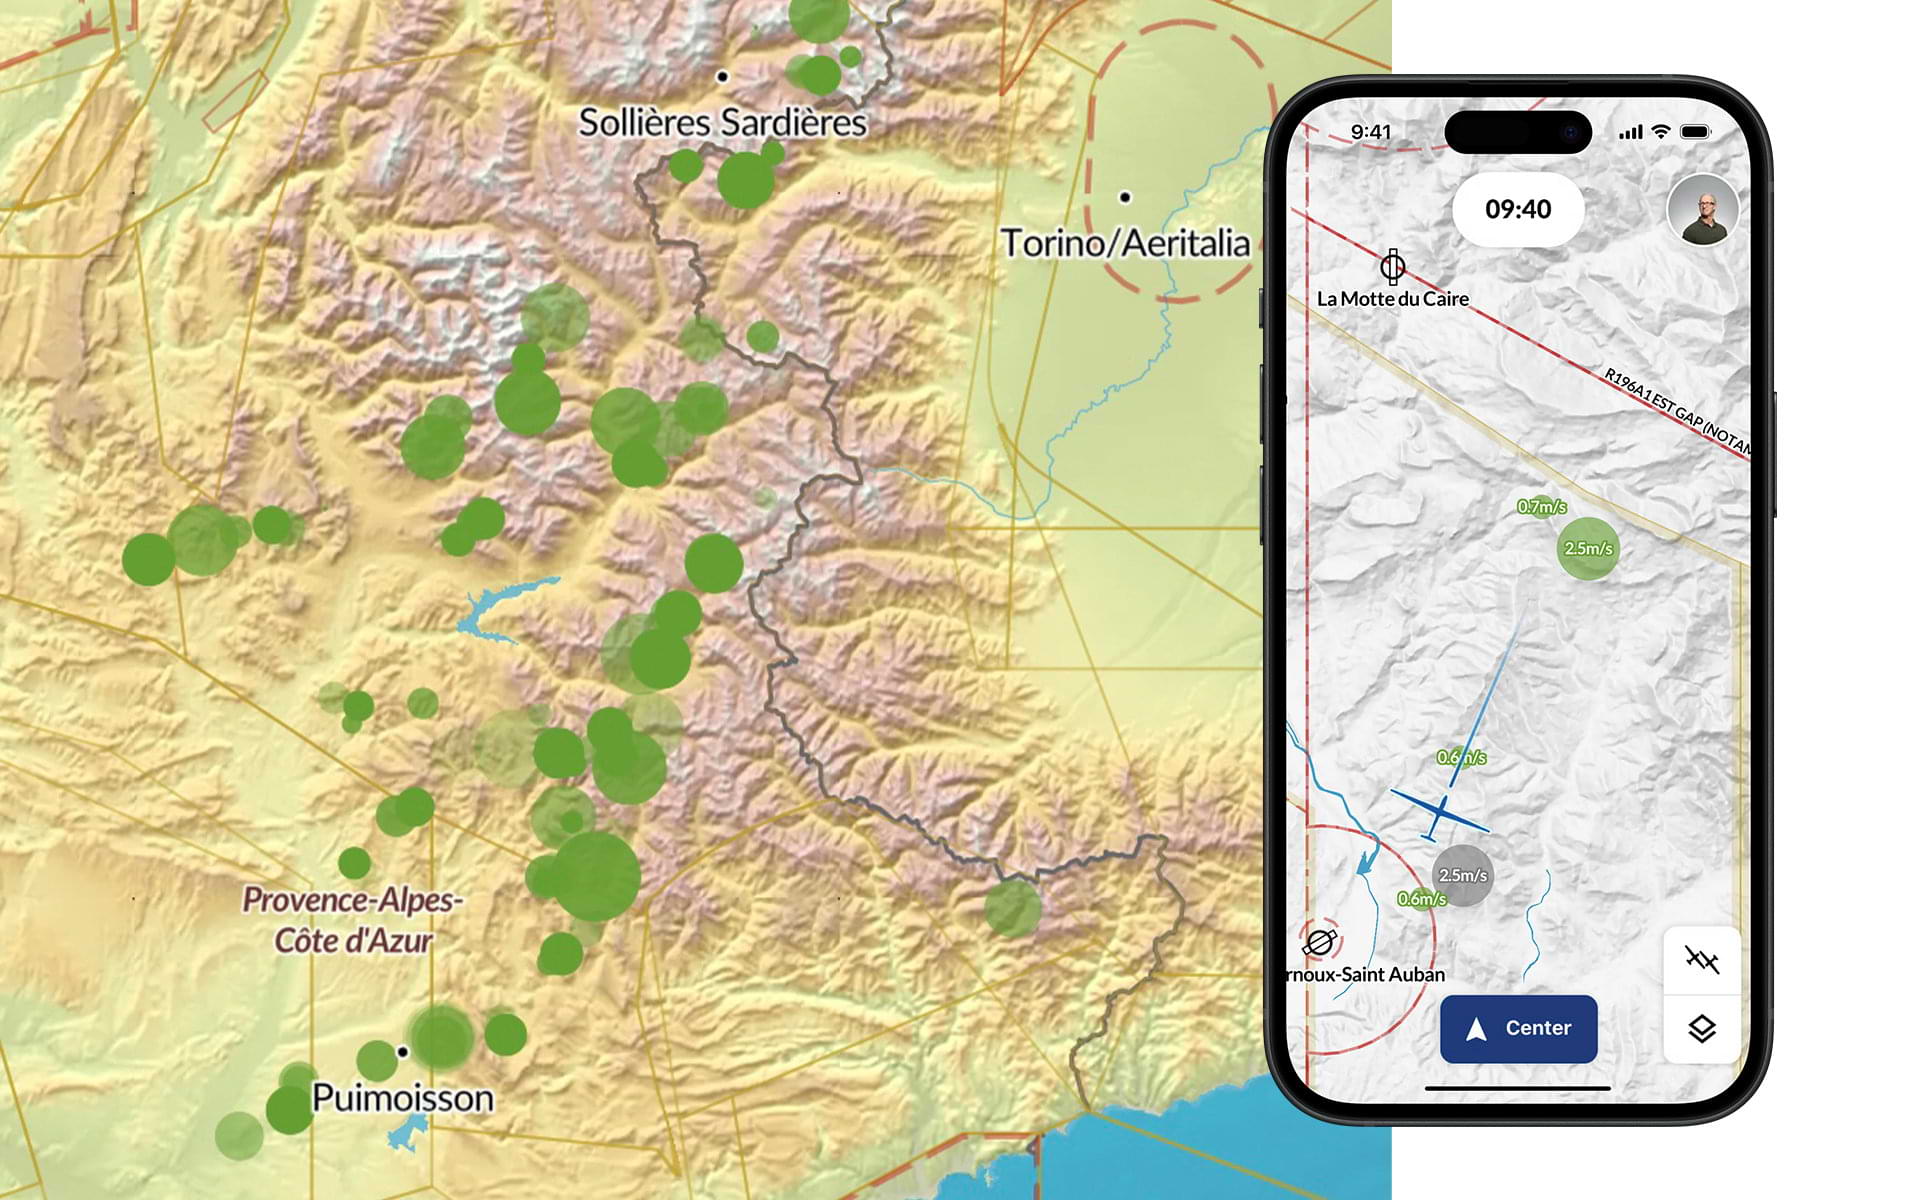
You not only get detailed information about an updraft in your vicinity. You can also get a good overview of the updraft development/strength on your route by simply zooming out. This map is updated every two seconds. As soon as a glider starts circling, you will see the thermal appear in Copilot.
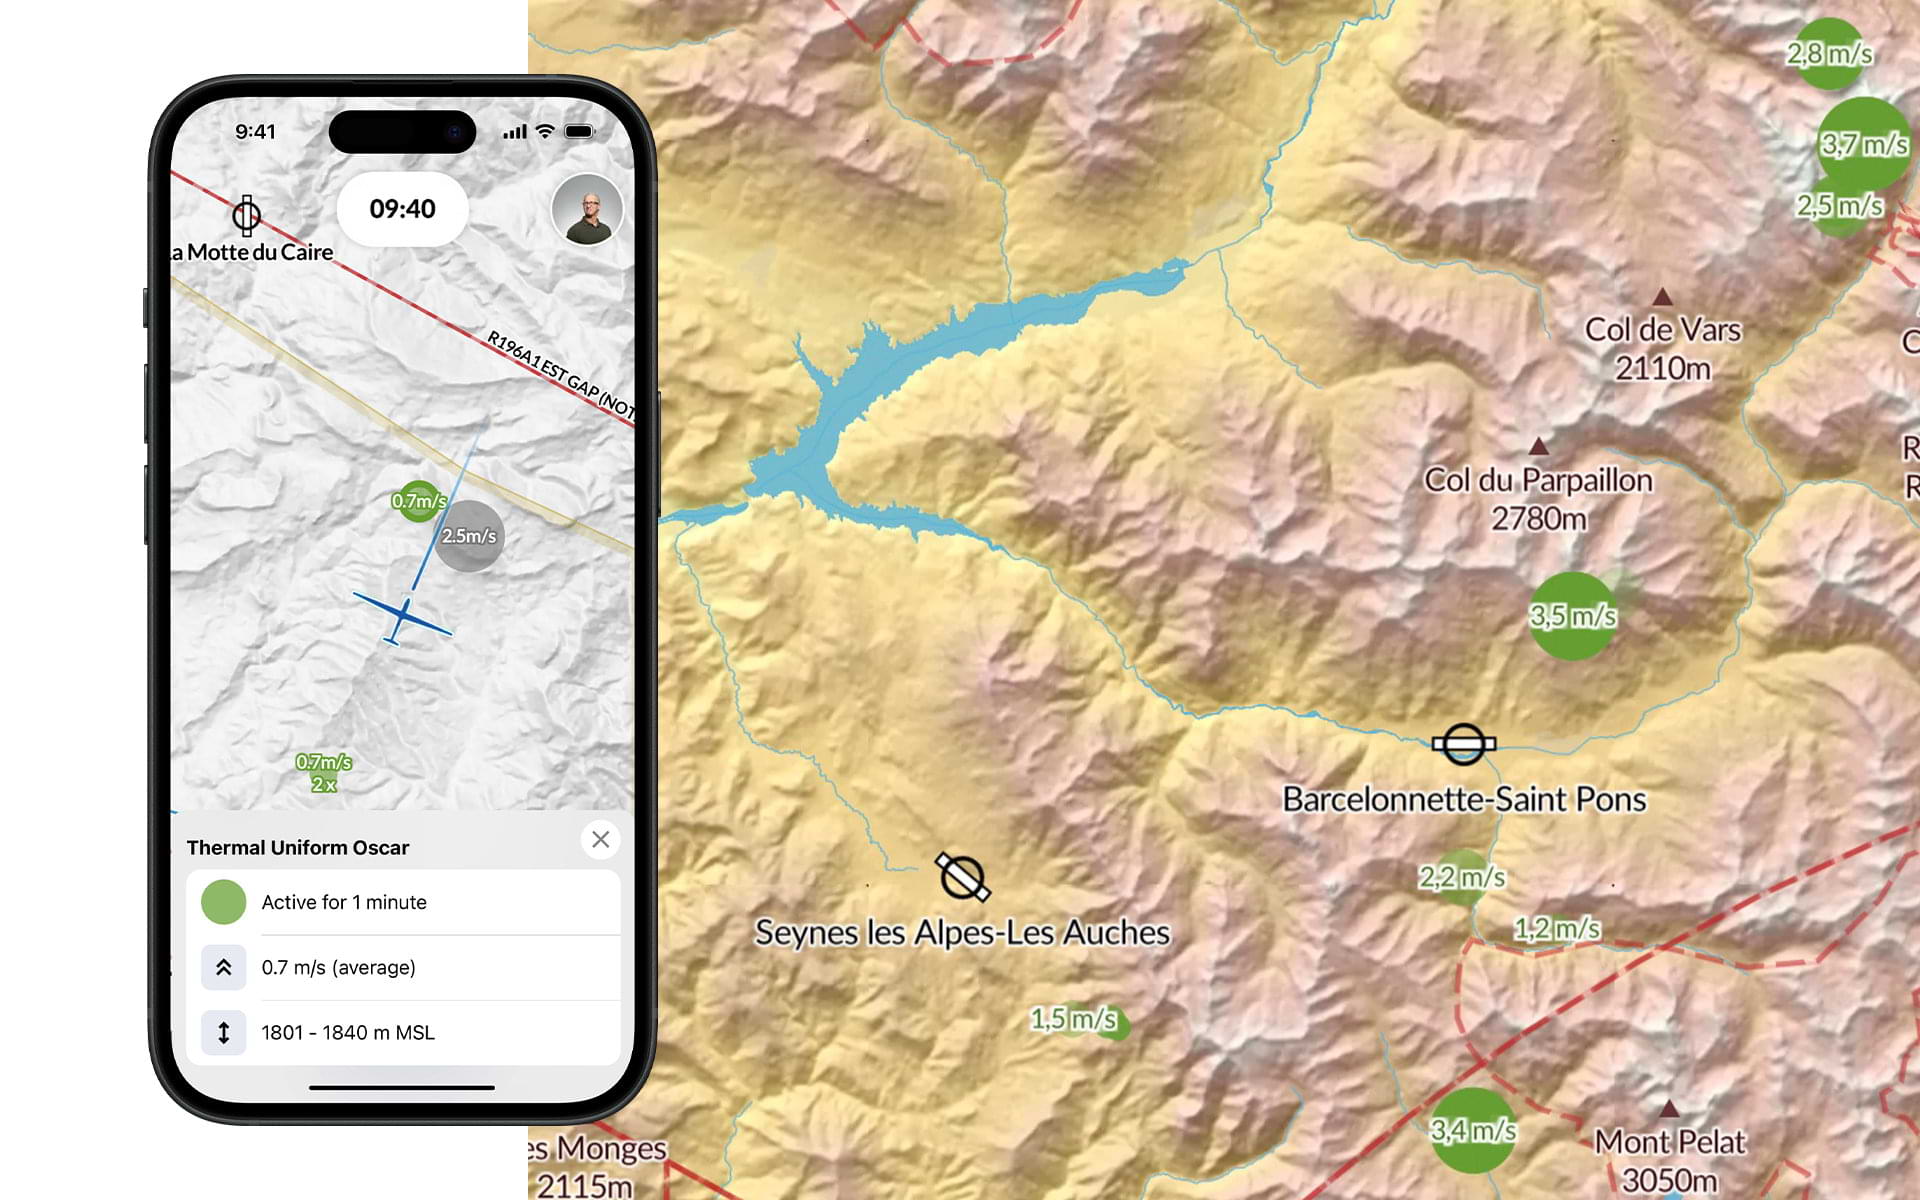
Are you wondering at what altitude the glider has circled, or how long the updraft has been active? If you tap on the thermal, further information will pop up. Gray thermals are not active anymore. They are visible for up to 10 minutes after the glider left the updraft. If you tap on a gray thermal, you will be shown how long the updraft has been inactive. 2x below the climb value of the southern updraft means that there are currently two gliders in the thermal. The integrated climb value (10s) corresponds to the glider that has already achieved the greater absolute height gain in the thermal.
Satellite images
Our aim is to generate fresh satellite images for you as often as possible to give you the best possible overview of weather developments. In Europe, we have managed to give you a new satellite image every 5 minutes. America has images of exceptional quality every 10 minutes.
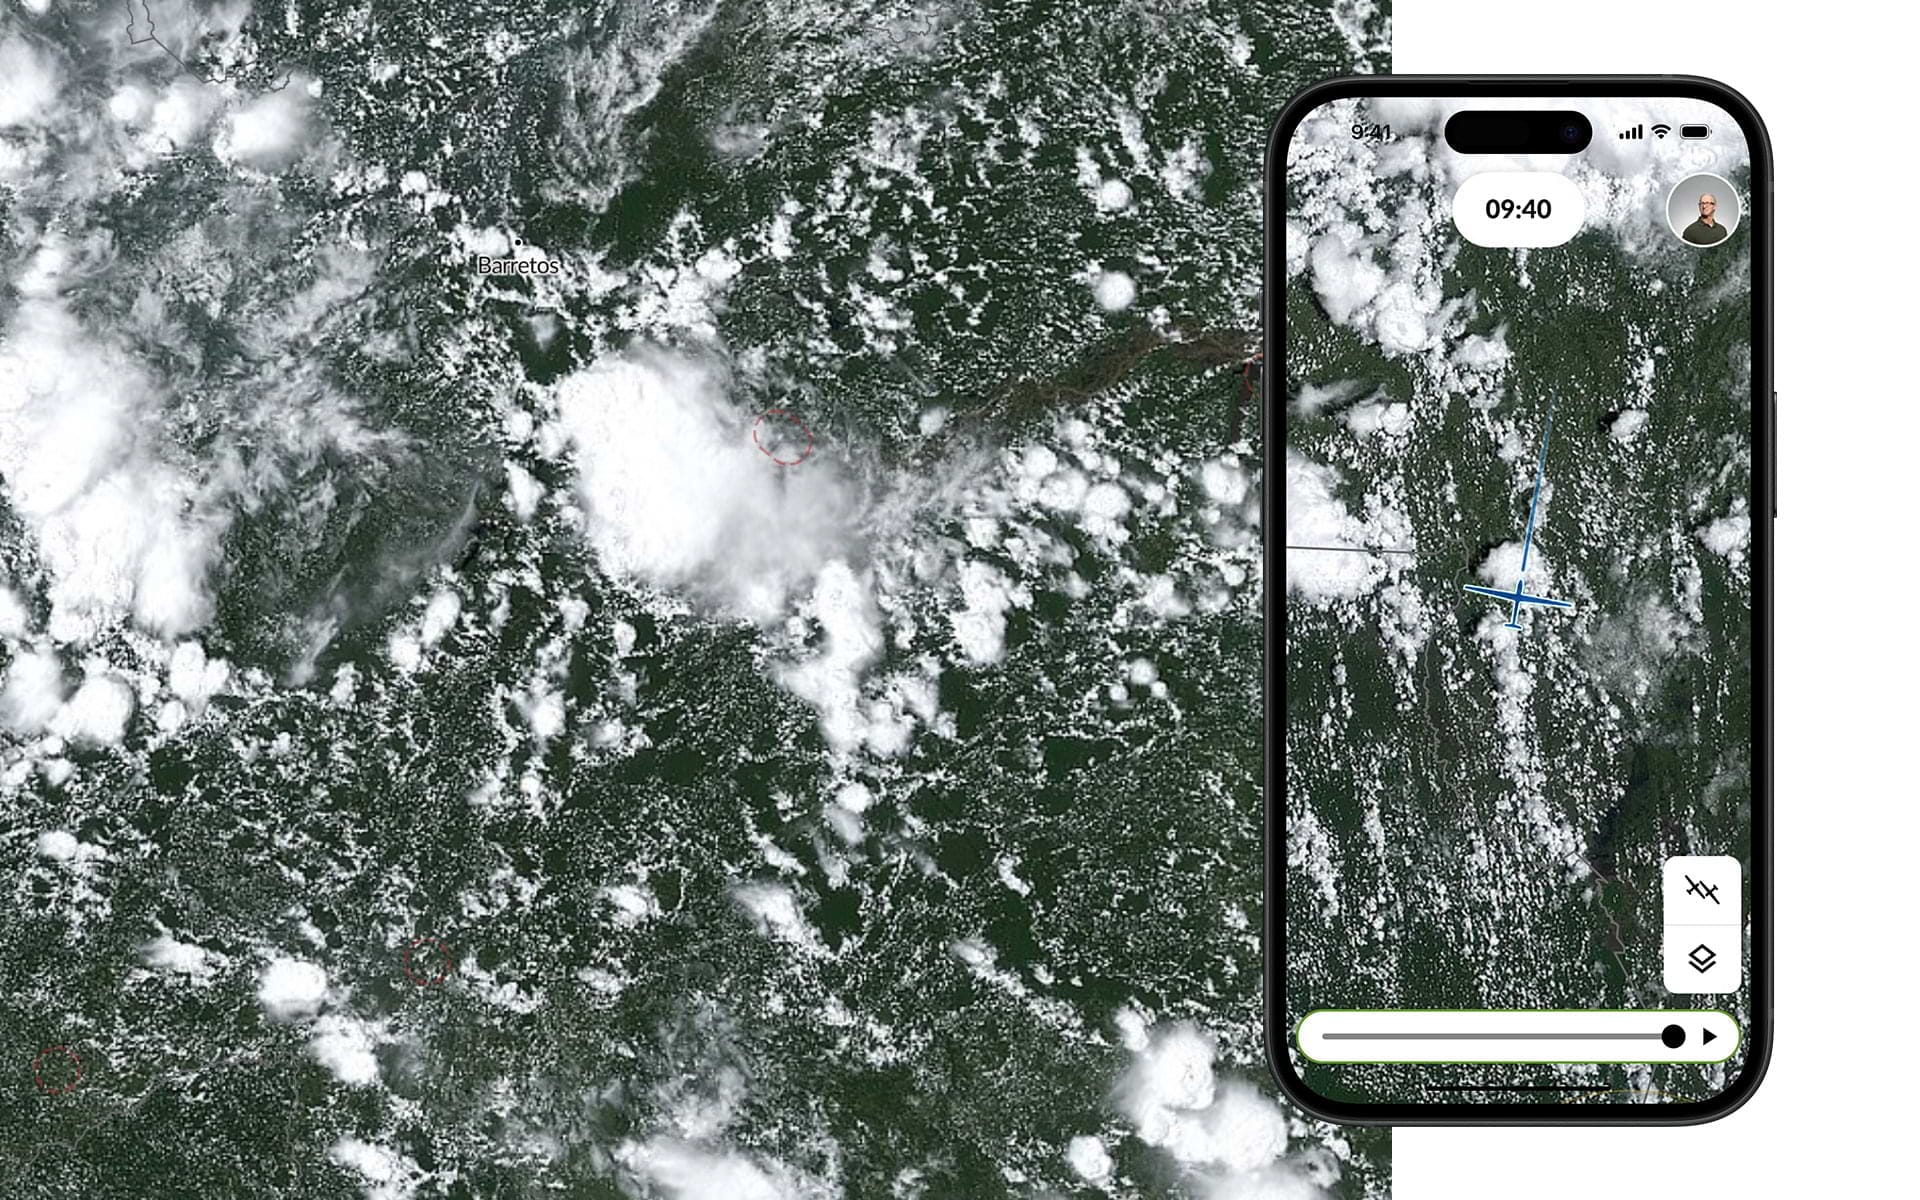
You can run a loop in the slider (below) to better estimate the movement of the weather. The clock (top) shows the time of the current image. A rain radar can also be displayed.
Live Tracking
The gliders can be shown or hidden at any time using the button at the bottom right. You therefore have the option of keeping each map view minimalist or combining it with all gliders.
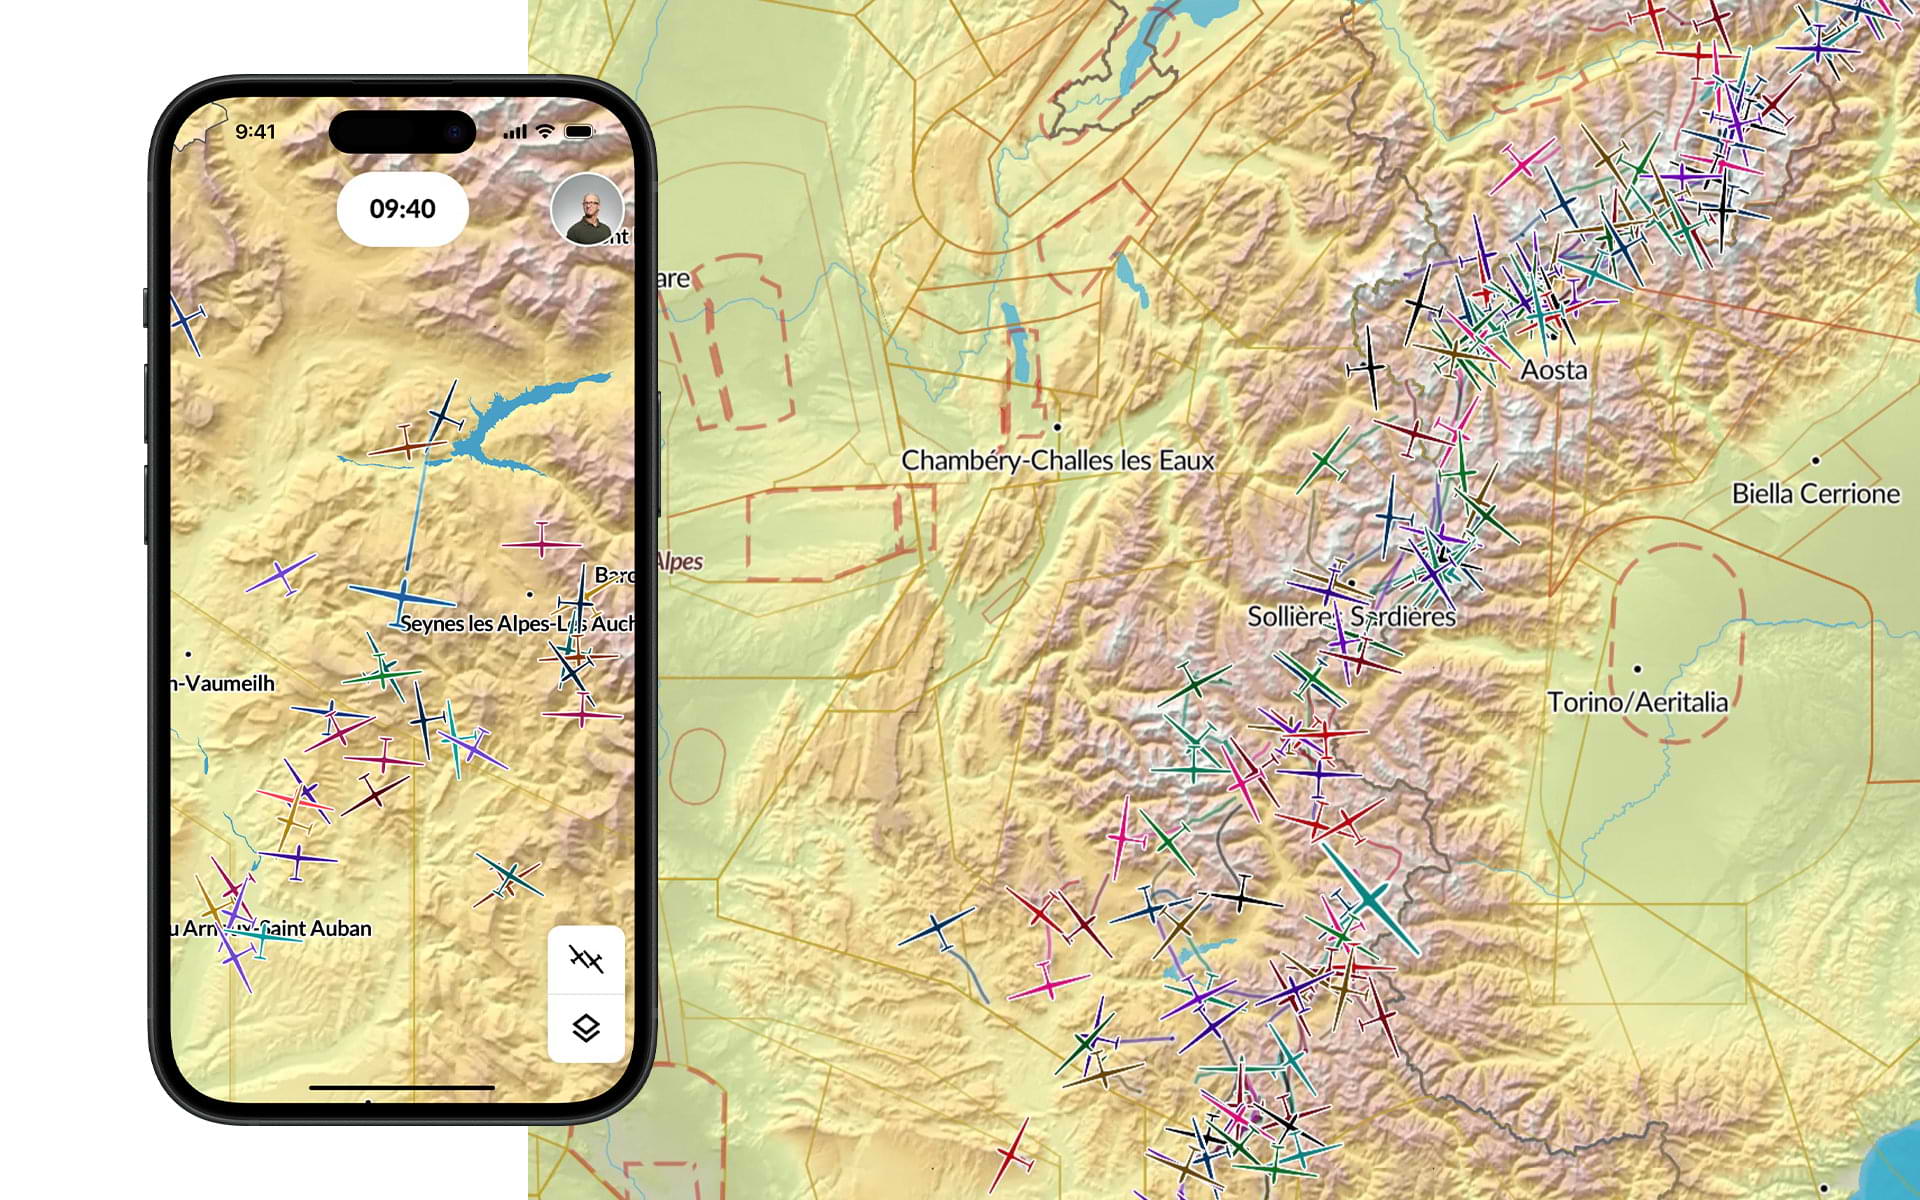
In addition, you will see the information about the aircraft known from WeGlide Live when you tap on it. If you connect to your aircraft in Copilot or on WeGlide, names will even appear in the Live Tracking. If you press the center button, you are always positioned in the middle. The heading line provides information about your flight direction.
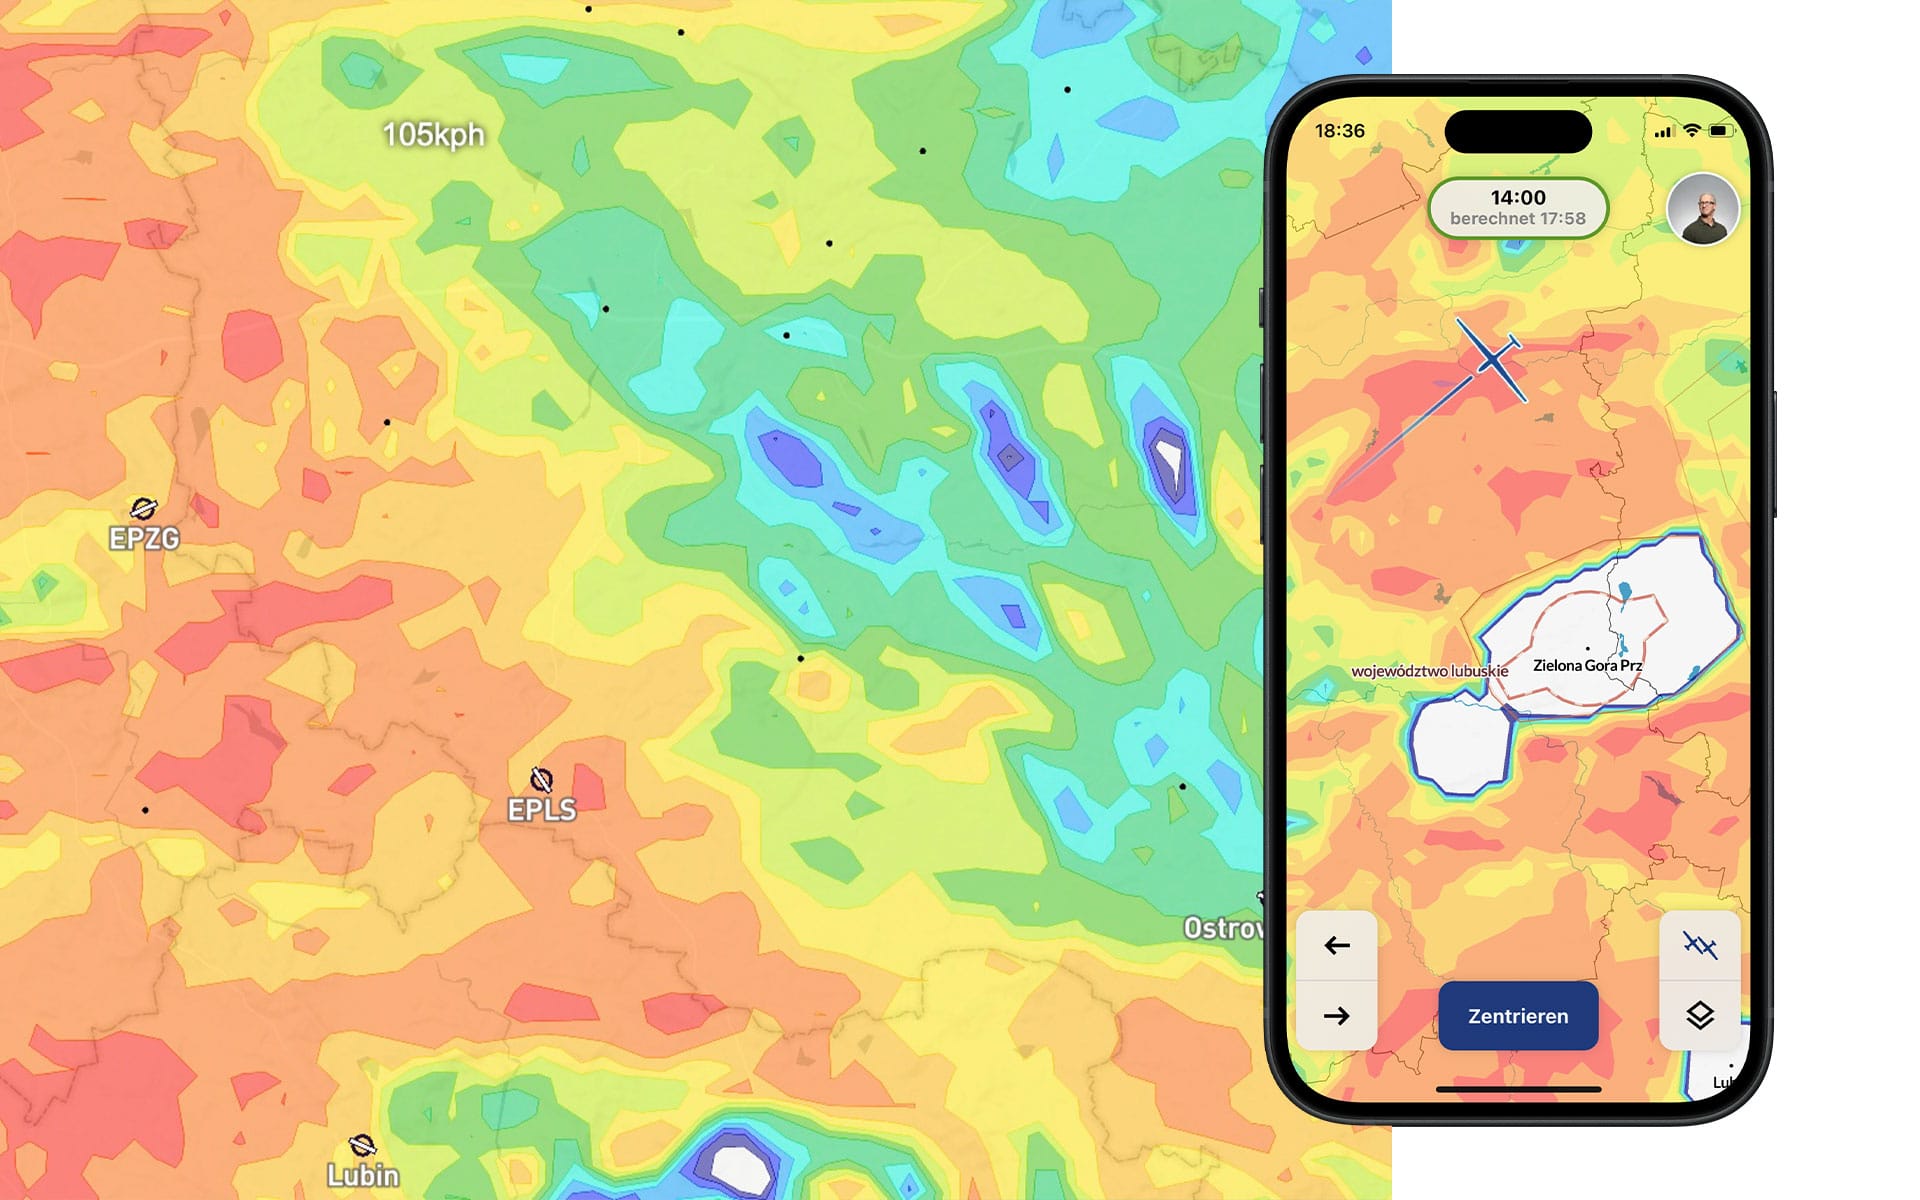
SkySight
We have integrated three SkySight forecast charts into Copilot. You can view the predicted flight distance, the hourly XC speed and the wave forecast in flight. Of course with the reliable Copilot performance in case of poor internet connection.
Technical
Internet reception in the air is sporadic and unreliable. Nevertheless, new weather information and real-time data are needed. Copilot makes use of technical innovations such as the internet standard HTTP/3 and modern compression methods to make optimal use of the connection.
If the connection quality drops, the system intelligently falls back on stored data and only retrieves what is absolutely necessary. If the connection is completely lost, the system switches to offline mode. Worldwide terrain maps and the most recently retrieved information are still available then.
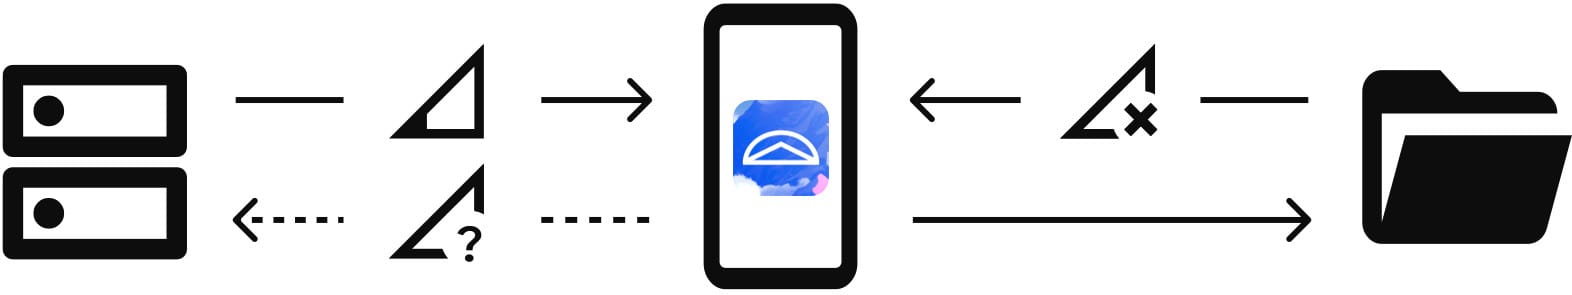
The system recognizes within a second whether the connection has been re-established and maps and real-time information are intelligently reloaded.
"A few seconds with weak LTE reception in flight were enough and Copilot updated itself completely," reports Nils Fecker.
14 days free trial
Live tracking with all functions will be free of charge. Our live maps are included in the subscription (so you also get WeGlide features such as 3D flight view, statistics list and phase analysis). SkySight maps are available when you connect your SkySight account in Copilot. The live satellite images are included in the WeGlide or SkySight subscription. We have reactivated the 14-day trial period for all users. So everyone can try out the WeGlide Copilot. The following link will take you to the free trial period:
If you would like to receive articles like this directly by e-mail, you can sign up for this in your profile:
 Joshua Rieger