Taking the Next Step
Newsletter

-- English below --

Vor zweieinhalb Jahren haben wir angefangen, eine Plattform zu bauen, um Segelflugbegeisterte auf der ganzen Welt zu verbinden und unser schönes Hobby zugänglicher zu machen. Seitdem ist viel passiert und wir sind gespannt auf alles, was noch kommt.
Die Ziele, die wir uns damals gesetzt haben, verfolgen wir weiterhin jeden Tag. Wir möchten eine Webseite bauen, die du gerne nutzt. Wir möchten den Segelflug als Sport fördern und neue Pilotinnen und Piloten anziehen. Und vor allem möchten wir Werkzeuge schaffen, die dir helfen, dich persönlich weiterzuentwickeln.
Wir führen nun ein Abonnementmodell ein, das es uns ermöglichen soll, weiterhin in Vollzeit an diesen Zielen zu arbeiten und dir das bestmögliche Erlebnis zu liefern. Dabei ist uns wichtig zu betonen, dass unser Hauptaugenmerk immer darauf liegen wird, die kostenlose Version zu verbessern und Funktionen zu entwickeln, die allen zur Verfügung stehen.
Wir haben uns viel Mühe gegeben, neue Funktionen zu entwickeln, die dir gefallen werden. Vor ein paar Wochen haben wir 60-Minute Speed veröffentlicht, das dir im Barogramm zu jeder Zeit die Geschwindigkeit der letzten Stunde anzeigt. Darauf bauen wir nun auf, um dir tiefe Einblicke in deinen Flugstil zu geben.
Zusammen mit dem Abonnementmodell veröffentlichen wir die Flugphasen-Analyse in WeGlide Live, diese ist frei zugänglich. Das heißt, dass du dir nun in unserem Live-Tracking Informationen wie Thermikstärke oder Gleitleistung zu allen Flügen anzeigen lassen kannst.
Hier sind die neuen Premium-Funktionen:
Phasenanalyse
Hast du dich jemals gefragt, welche Gleitzahl du auf einem bestimmten Teilstück erflogen hast oder wo du während deines Fluges Zeit verloren hast?
Unsere neuartige Analyse zeigt dir auf der Karte und im Barogramm die Aufwinde in grün und Einkreisversuche in rot an.
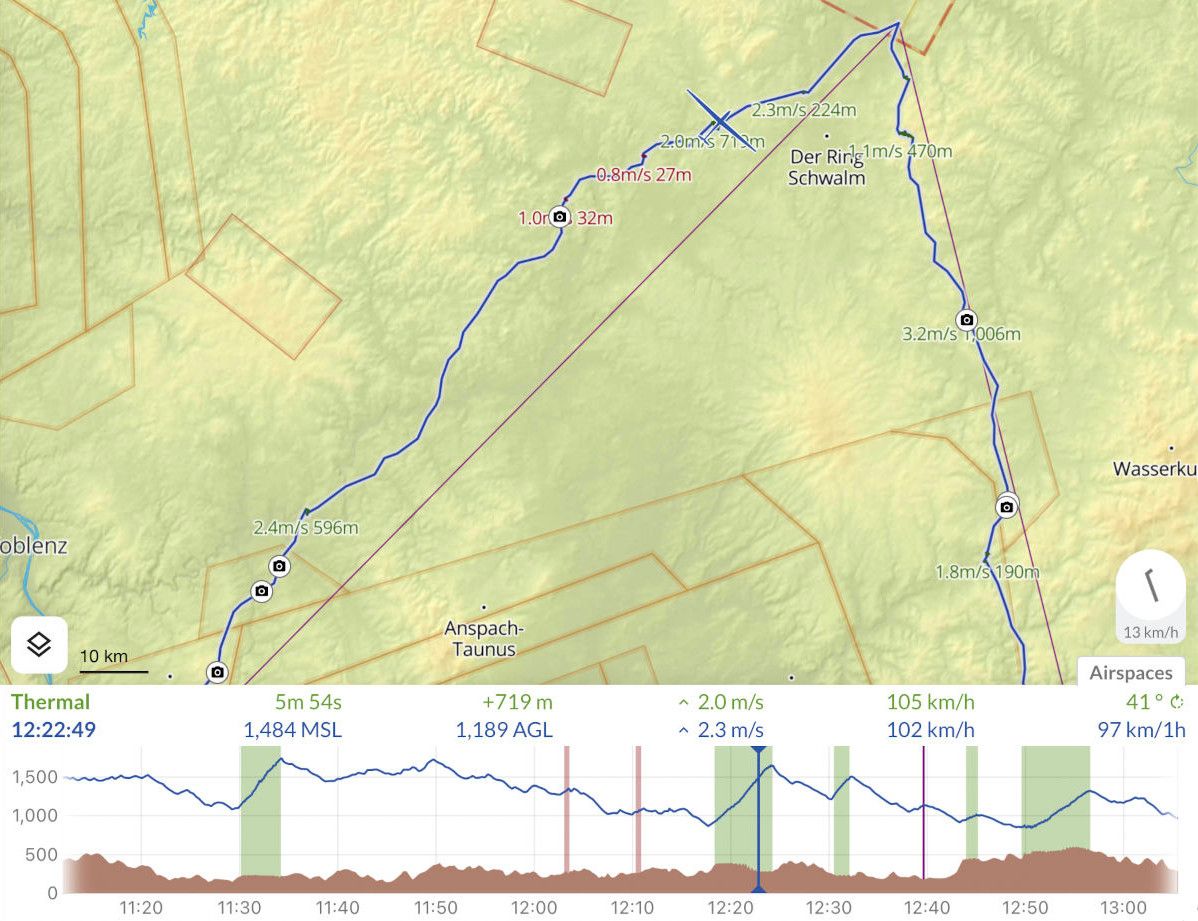
Über dem Barogramm erscheint eine zusätzliche Zeile mit Informationen zur aktuellen Position im Flug. So werden je nach Flugphase (Kreisen, Kreisversuch oder Gleiten) die dafür relevanten Daten angezeigt, wie z.B. durchschnittliches Steigen, Gleitzahl über die gesamte Phase, durchschnittliche Geschwindigkeit und so weiter.
Die Windanzeige in der rechten Ecke liefert zusätzliche Informationen zu jedem Zeitpunkt des Fluges.
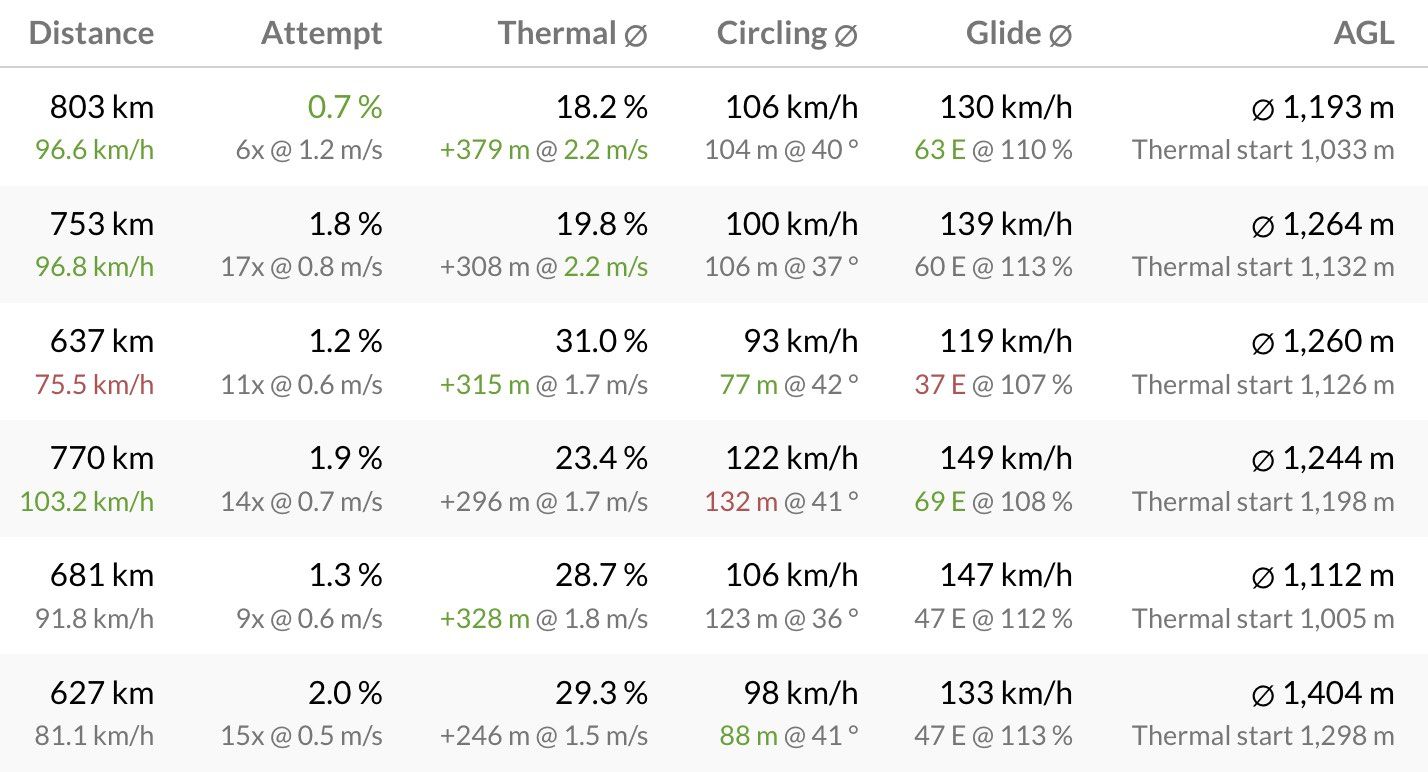
Statistik Liste
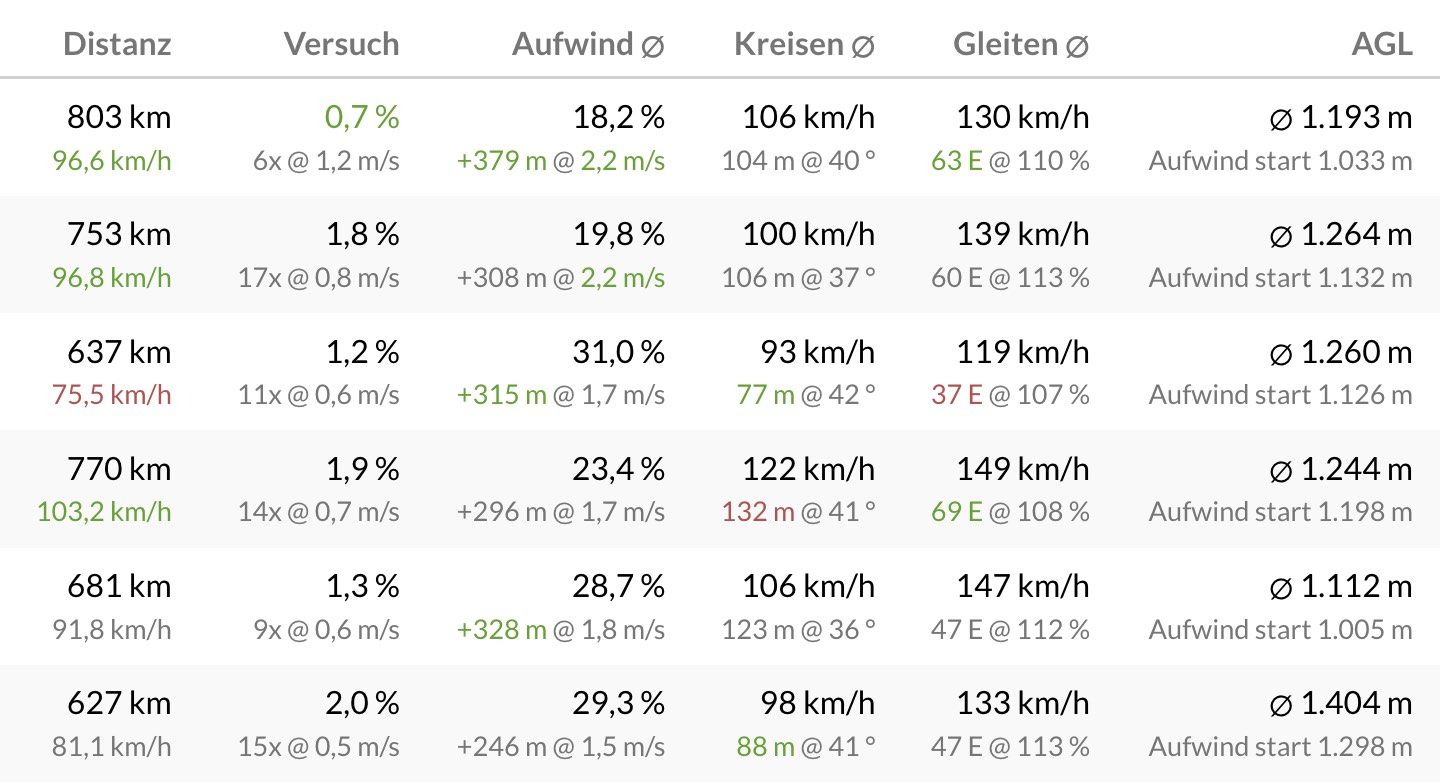
Um deinen Flugstil kontinuierlich zu verbessern, ist es wichtig, einige Statistiken wie Gleitzahl und durchschnittliches Steigen zu analysieren. Aussagekräftig werden diese Zahlen aber erst, wenn man sie mit denen anderer Flüge vergleicht.
Du kannst jetzt die Statistiken in jeder Flugliste auf WeGlide sehen, indem du den Schalter in der unteren rechten Ecke auf 'Statistiken' stellst. In der Tagesliste siehst du so genau, wer die meisten Höhenmeter pro Aufwind gekurbelt ist, wer im Gleitflug am wenigsten Höhe verlor und wer am wenigsten Einkreisversuche benötigte.
Oder möchtest du deinen Fortschritt von Flug zu Flug verfolgen? Dann sieh dir einfach die Statistiken für deine Flüge an und du erkennst sofort, wie sich dein Flugstil verändert hat.
Mehrere Top-Pilotinnen und Piloten haben die Statistikliste in den letzten Wochen getestet und waren erstaunt, wie einfach es nun ist, zu erkennen, ob jemand zu flach kurbelt, ob jemand beim Versuch einzukurbeln viel Zeit verloren hat oder beim Vorfliegen nicht die beste Linie trifft.
Tagesrückschau
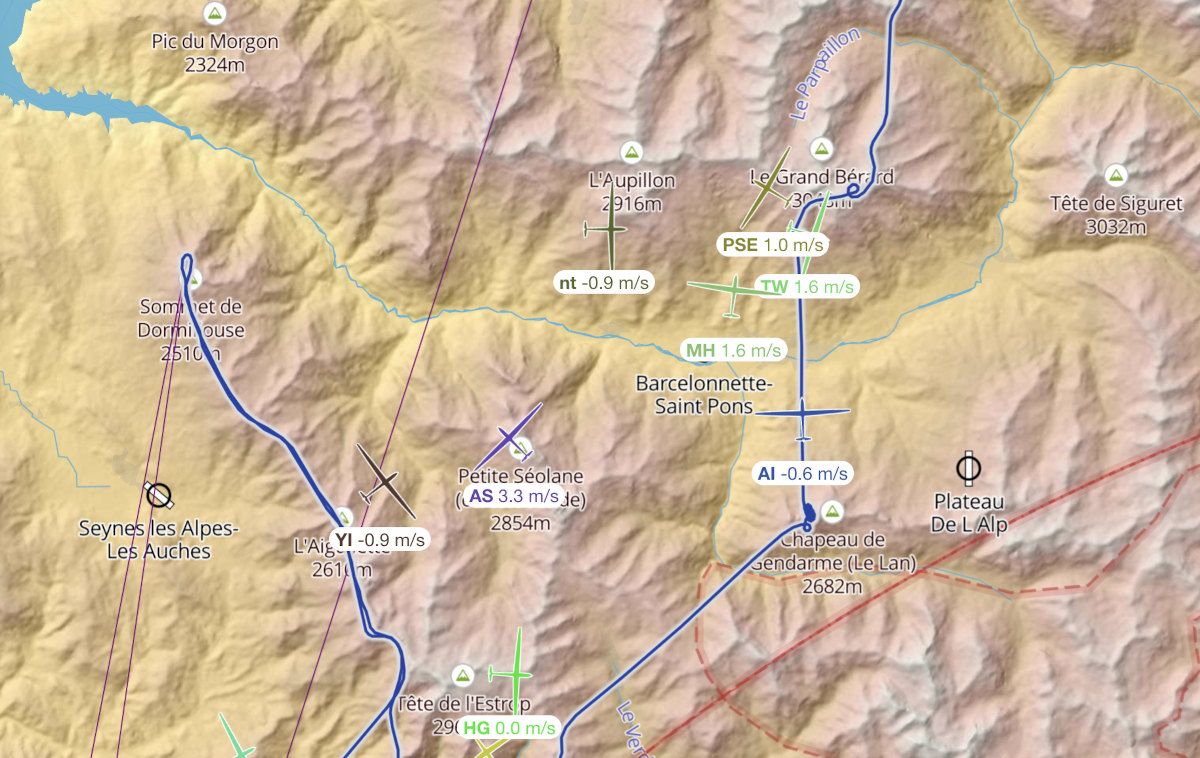
Hast du dich jemals gefragt, wo andere Flugzeuge zu einem bestimmten Zeitpunkt deines Fluges unterwegs waren? Die Tagesrückschau zeigt dir zu jedem Zeitpunkt alle anderen Segelflugzeuge, die ebenfalls in der Luft waren. Wenn du durch das Barogramm scrollst, siehst du die anderen vorbeifliegen. Dabei kannst du dir entweder die Höhe, die Steigrate oder die 1-Stunden-Geschwindigkeit der Segelflugzeuge auf der Karte ansehen.
Zudem kannst du einstellen, dass dir nur der Verkehr angezeigt wird, der auf demselben Flugplatz gestartet ist wie du.
Lokale Wettbewerbe
Es ist jetzt so einfach wie nie, deine Freunde oder Vereinskollegen herauszufordern, eine Aufgabe mit dir zu fliegen - erstelle einfach einen lokalen Wettbewerb auf WeGlide!
Wenn du eine Aufgabe planst, hast du jetzt die Möglichkeit, sie als lokalen Wettbewerb anzulegen, sodass automatisch jeder Flug gewertet wird, der den Kriterien der Aufgabe entspricht.
Einerseits hast du die Möglichkeit, alle Flüge eines bestimmten Tages zu werten, wodurch du mit deinen Freunden einen kleinen zentralen Wettbewerb fliegen und auswerten kannst. Es gibt sogar verschiedene Regeln wie Grand Prix und AAT.
Andererseits kannst du aber auch eine Aufgabe erstellen und alle Flüge von deinem Heimatflughafen ohne die Beschränkung auf einen bestimmten Tag darauf werten. So lässt sich beispielsweise ein beliebtes 300-km-Dreieck erstellen, vielleicht mit 10-km AAT-Zylindern, und welches Vereinsmitglied es in einer Saison am schnellsten fliegen kann, gewinnt.
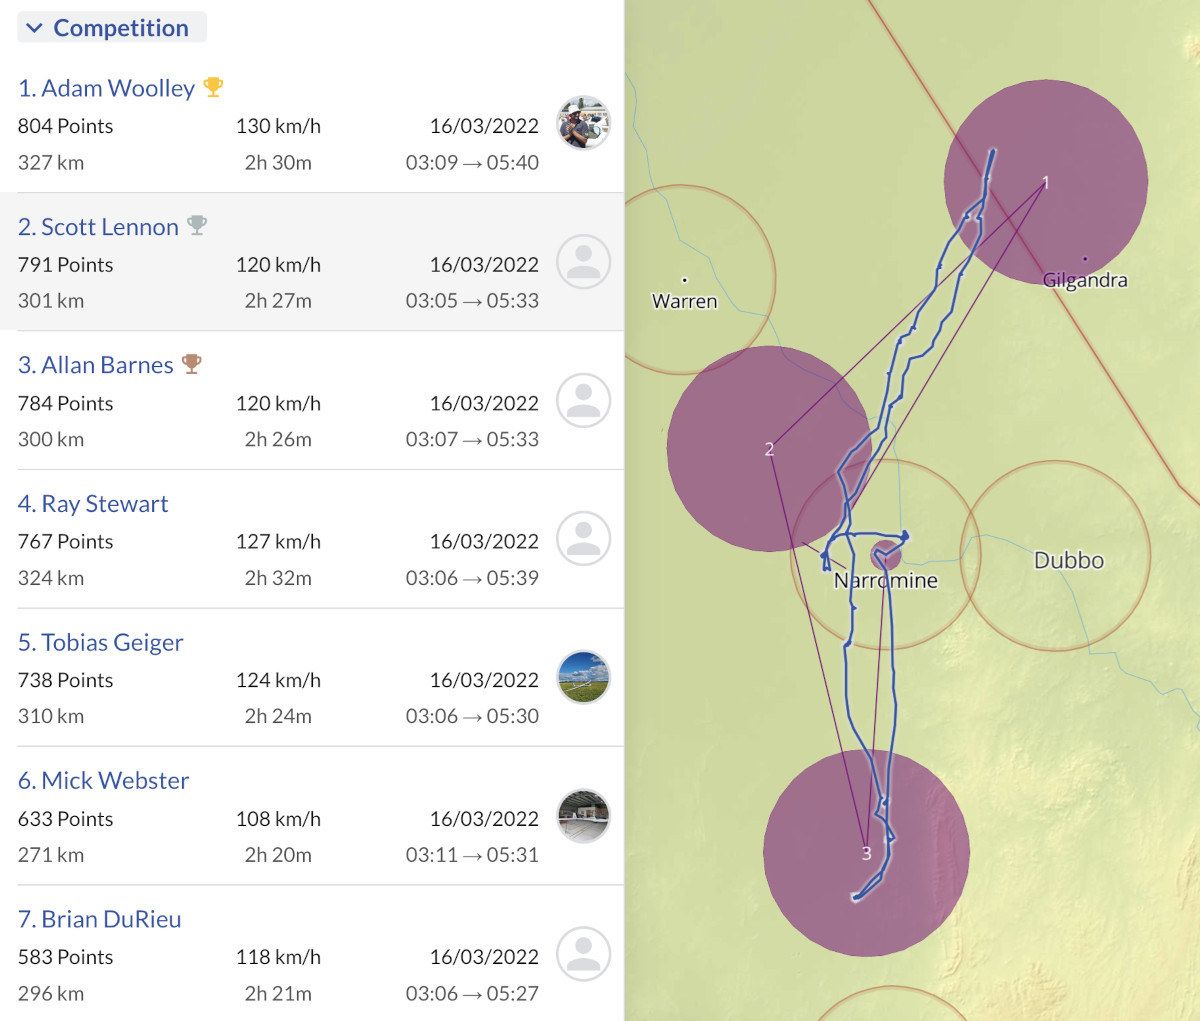
Diese Funktion kann auch mit der Statistikliste kombiniert werden, um die Performance auf einer Aufgabe zu vergleichen. Als Beispiele kannst du dir die Matterhorn Challenge oder Tag 8 der Australian Nationals anschauen. Weitere Informationen zu lokalen Wettbewerben und allen anderen Premium-Funktionen findest du in den Docs.
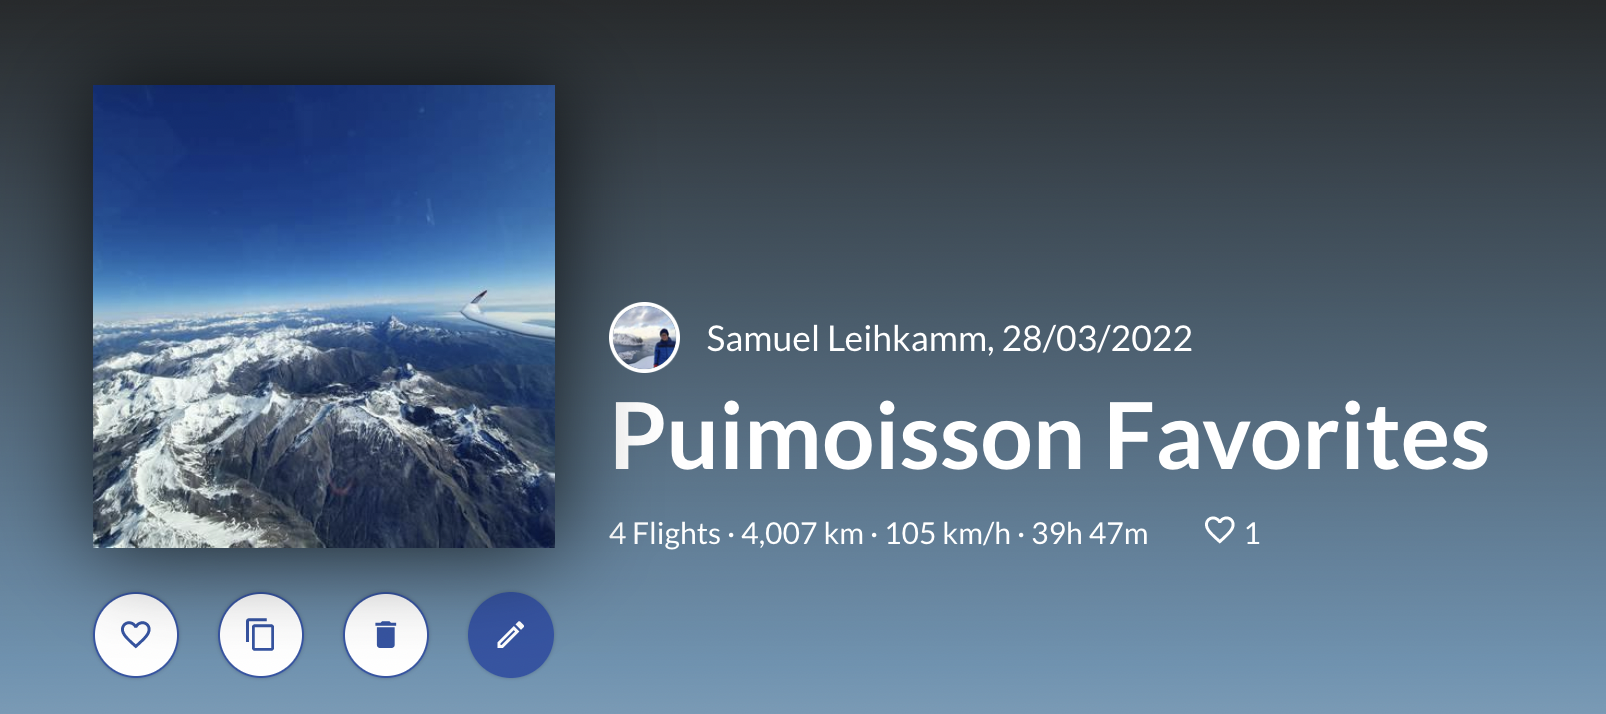
Sammlungen
Wolltest du schon immer den Überblick über bestimmte Flüge behalten? Genau wie mit Playlists in deiner Musik-App kannst du jetzt auch Flüge in Sammlungen organisieren.

Es gibt viele verschiedene Möglichkeiten, wie Sammlungen verwendet werden können: Du kannst besondere Flüge und Urlaubserinnerungen teilen, dich auf einen großen Wellenflug vorbereiten, oder deine Außenlande-Geschichten mit schönen Bildern sammeln.
Du hast sogar die Möglichkeit, private Sammlungen zu erstellen, die niemand finden kann.
Loslegen
Wenn du uns auf unserem Weg unterstützen möchtest, ein nützliches Portal für die Segelfluggemeinschaft weltweit zu schaffen und Segelfliegen für die Außenwelt sichtbarer zu machen, dann lege jetzt los und wähle den Plan aus, der für dich passt.
Dankeschön
Wie immer freuen wir uns auf dein Feedback und darauf, die neuen Funktionen im Lauf der Zeit zu verbessern und zu erweitern.
Vielen Dank für eure schönen Flüge, euer nettes Feedback und die vielen Fotos, die ihr jeden Tag hochladet.
Johannes, Moritz and Samuel
Taking the Next Step
Two and a half years ago, we set out with the goal of building a platform to connect glider pilots around the world and make our beautiful hobby more accessible. A lot has happened since then and we are excited thinking about the path forward.
The goals we set out with are still the same goals we are striving for every day. Make a website pilots enjoy using. Promote gliding as a sport and attract new people. Develop tools that help you become a better pilot.
We are now launching a subscription model that will allow us to continue to work full-time to achieve these goals. Our main focus is and always will be to improve the free version and to build features available to all pilots.
We have put a lot of effort into building new functionality you will love. A few weeks ago we released 60 Minute speed, and now we build on that to give you deep insights into your flying style and spot weak points.
Along with the subscription model, we are releasing the Phase Analysis feature for all flights in WeGlide Live. That's right, anyone can now get information regarding thermal strength or glide performance for all flights in our live tracking.
Also, the task planner has received an update, you can now plan a task with different rulesets. Unless you are taking part in a national competition (like the German DMSt), your task is evaluated by the rules you have declared it with.
Here are the features you get for supporting us.
Phase Analysis
Have you always wondered what L/D you achieved in a particular section or where you lost time on your flight? Phase Analysis shows you all your thermals in green and thermal attempts in red on the map and in the barogram.
A row of information is added, and when hovering above a phase (thermal, thermal attempt, or glide) in the barogram, you can see all the details like height gain and average vario for thermals or L/D and flying speed for glides.
The wind indicator in the right corner provides additional information for every point along the flight path.
Statistics List
To improve yourself, it's crucial to analyze some statistics like L/D and average climb rate to determine how you can improve your flying. But those numbers only become meaningful when they are compared to those of other flights.
You can now turn every list on WeGlide into a list of statistics, using the toggle in the lower right corner. With the daily list, you can see exactly who climbed the most meters per thermal, who lost the least height while cruising or who needed the least thermal attempts.
Want to track your progress over time? Simply view the statistics for the list of your flights and see in which areas you have improved. Comparing yourself to other pilots really shows you where you can improve.
Many top pilots have tested the statistics list in the last weeks and they were amazed to see how easy it was to spot if someone was circling too wide if someone was clearly losing time attempting to enter a thermal, or was not hitting the rising air while cruising.
Day Replay
Ever wondered where other pilots flew with respect to you? Day Replay will show you all gliders that were in the air at each point of your flight. Scroll through the barogram and watch the traffic fly by. You can either see the altitude, the rate of climb, or the 1-hour speed of the other gliders on the map.
You can also choose to only see the traffic that started on the same airfield as you.
Local Competitions
Challenging your friends or clubmates to fly a task against you is now as easy as it can be - just use Local Competitions on WeGlide! This has some similarities to what Proving Grounds is doing, but if you furthermore want to enjoy task sheets and ranking boards, you should check out their offer for clubs.
When planning a task, you now get the option to host it as a local competition, which automatically scores every flight matching the criteria of the task.
You can either score all flights from a particular day, which allows you to fly and evaluate a central competition. There are even different rules like Grand Prix and AAT.
Or, you can set up a task and score all flights from your home airport on it, without a specific day. So you could set up a popular 300 km triangle, maybe with 10 km AAT cylinders, and whoever from your club can fly it the fastest in one season wins.
This feature can also be combined with the Statistics List to compare your performance on a task. For an example, check out the Matterhorn Challenge or Day 8 of the Australian Nationals. You can find more information about Local competitions and all the other premium features in our docs.
Collections
Have you ever wanted to keep track of some outstanding flights? Just as with playlists in your music app, you can now organize flights in collections.
There are many different ways in which collections can be used. You can share special flights and memories from vacation, prepare for a big wave flight or collect your outlanding stories with nice images.
You even have the option to make collections private so no one else can find them.
Get Started
If you want to support us on our journey to build a beautiful home for the gliding community and to make gliding more visible to the outside world, then get started now, select the plan that fits your needs, and enjoy all the new features.
Thank You
As always, we are looking forward to hearing your feedback and to improving and adding new features over time.
Thank you for your beautiful flights, for your kind feedback, and for the many photos you upload every day.
Johannes, Moritz and Samuel
 Samuel Leihkamm